
Leaflet for R
Leaflet for R is developed by the guys who brought us RStudio. It seems more documented than a package called leafletR so let us have a look at it. I will try this on RStudio Version 0.99.484.Installation
Installation works “flawlessly” by typinginstall.packages("leaflet")
into the R console. But first I ran in the problem that I need to upgrade R to the newest version as it was not upgraded by installing latest RStudio on my Ubuntu system. But as we have the package activated
library("leaflet", lib.loc="~/R/x86_64-pc-linux-gnu-library/3.2")
we can go ahead.
Let’s create a webmap
First we need to create a leaflet instance with a basemap embedded:m <- leaflet() m <- addTiles(m)Now we have a nice basis for the next step. Let’s add a thing from the last decade which is called a shapefile. But first make sure you have the dev libraries from rgdal and libproj installed. To enable R to work with shapefiles we will use the package rgdal:
install.packages("rgdal")
and enable it.
But we are interested in adding some layers as well:
polygons <- readOGR("polygon_feature.shp", layer = "polygon_feature", verbose = FALSE)
m <- addPolygons(m,data=polygons, fillColor = "black", group = "Polygon")# polygons
lines <- readOGR("line_feature.shp", layer = "line_feature", verbose = FALSE)
m <- addPolylines(m, data = lines, color = "black",opacity = 1,group = "Line") #to add a line with the layertext Line"
m <- addLayersControl(m,
  baseGroups = c("OSM (default)"),
  overlayGroups = c("Polyline", "Line"),
  options = layersControlOptions(collapsed = FALSE)
) # our layercontrol
m #will show the current map in the preview window
That was easy and the syntax is quite comparable to the one we know from leaflet. We can also add raster images up to 4mb of size:
r <- raster("min_image.tif")
m <- addRasterImage(m,r, opacity = 0.9, colors=gray.colors(255))
Check even more examples on the github.io page of Leaflet for R.
Exporting
The whole map is shown in the Viewer of RStudio: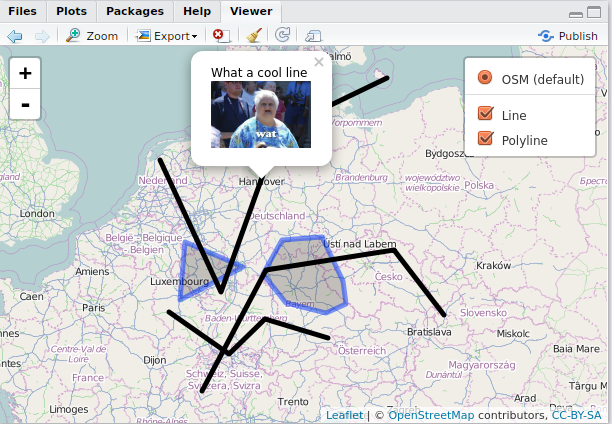
You can download the sample code and also the data for this example.
Very useful & thanks for the reference Riccardo! I’ll keep on digging in leaflet for R.
Uesful tutorial, thanks! May I suggest some (minor) edits in the script?
Line 14 of the downloadable script should be written as follows:
overlayGroups = c(“Polygon”, “Line”),
Otherwise polygon visualization in the map could not be manged;
moreover I would also have added:
install.package(raster)
library(leaflet)
library(rgdal)
library(raster)