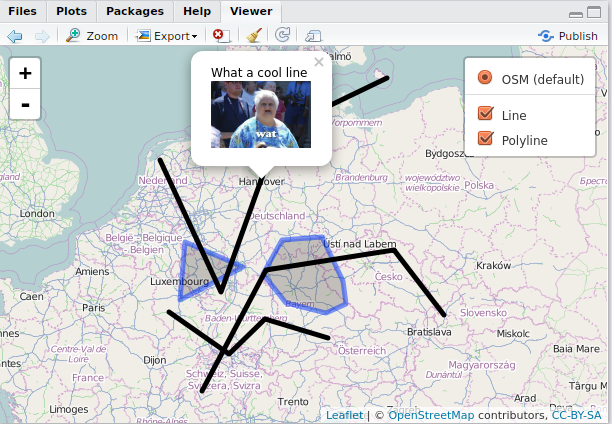
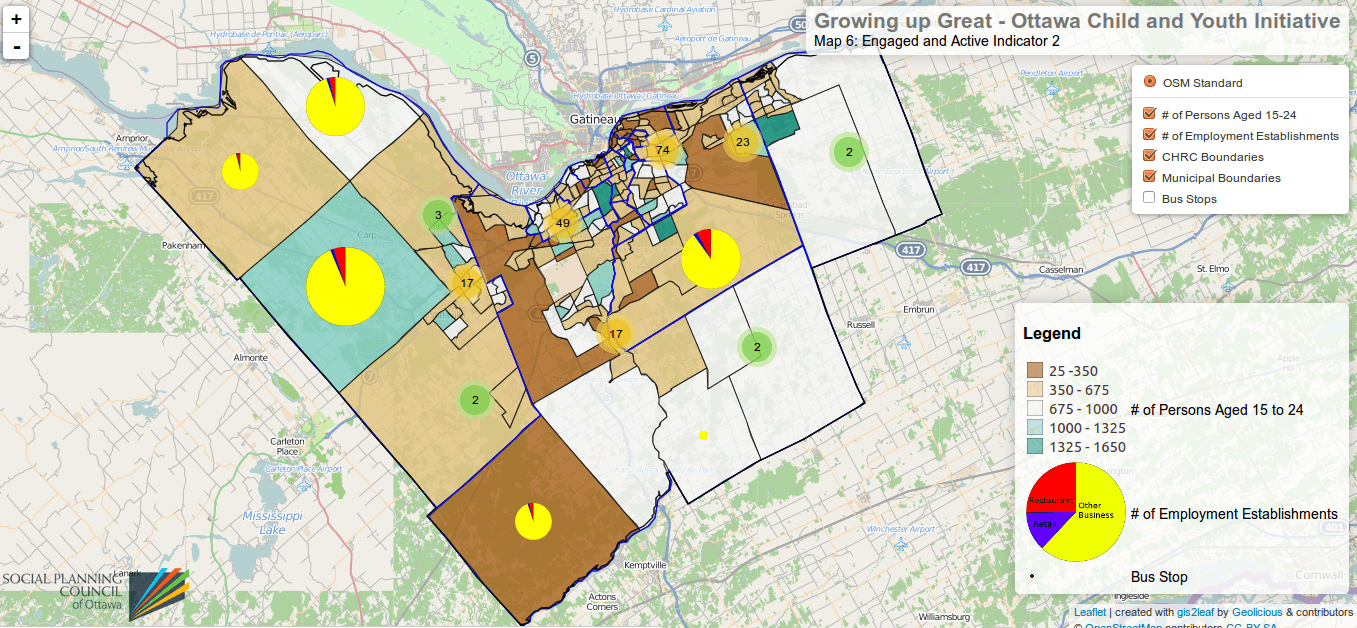
Using Jupyter for data analysis
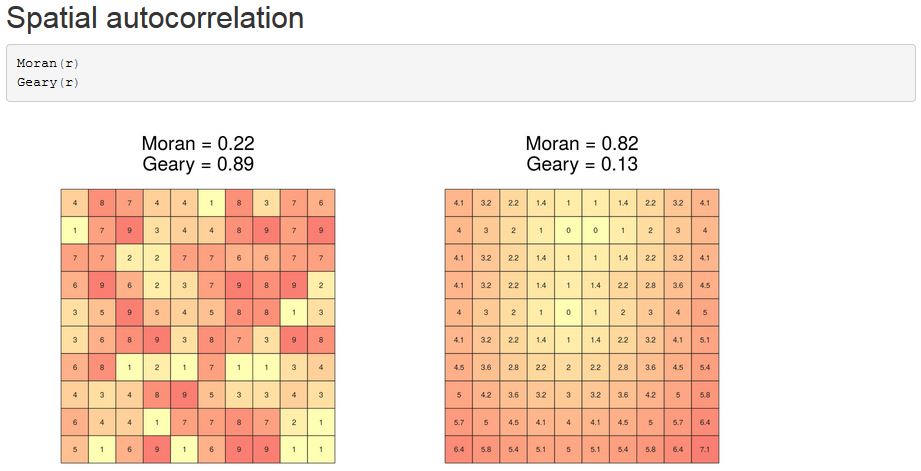
Data analysis in the modern-day computing industry is of great essence as the world tries to understand the data that has been accumulated in many systems across the globe. Extraction of useful information is a task being focused so much in most organizations as this is marking the lifetime for existence in the business world.
Overview: R Cheat Sheets
Recently we had a discussion about where to find a nice cheat sheet (No! We are not talking about Simon the Sorcerer walk-throughs). Especially for scripting languages cheat sheets are an excellent way to support your learning attempts and are a handy tool for your every work in data visualisation, automation of tasks and analysis steps. So let’s have a look on R cheat sheets.Create custom markers with R for your webmap
When it comes to webmapping there are thousands of possible markers you can choose from but when it comes to markers depending on the data, which is inside the shapefile, possibilities are more limited. In leaflet you can define different icons according to the attributes of your data by defining the icon url in an attribute. Let me show you, how to use the data in each feature to create a custom icon like a piechart marker using R.short announcement: new R learning material
Coursera, hail to Coursera. Despite the uprising criticism on MOOCs and their footprint in the educational landscape at universities Coursera created an interesting R learning course. It is divided and scheduled for 4 weeks and has video-tutorials as well as written material. The guys over at RevolutionAnalytics packed it all together: Content: Setting working directory and getting help How to get help Data Types Subsetting Vectorized Operations Reading/Writing Data Control Structures in R Writing Functions Avoiding loops using xapply Plotting Regular expressions Regular expressions in R Classes and methods in R It is a free course and is very userfriendly. The…
short announcement: RStudio with new debugger
I love scripting languages like R, MatLab, Python and Javascript. They are easy to learn and also fast in showing your results. But when it comes to debugging especially R- contrary to MatLab- had its problems with debugging: Finding failures in your code is often not this easy.
QGIS plugins: SEXTANTE
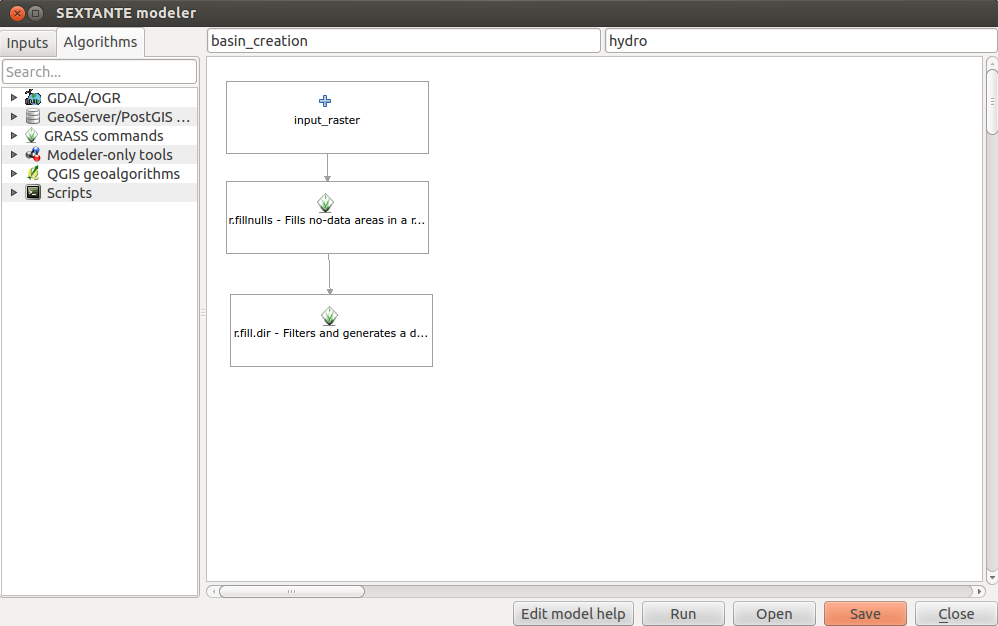
SEXTANTE by Victor Olaya is a powerful plugin that bundles many methods and applications from QGIS in one place and provides a GUI for your processing work flow which is comparable with the ArcGIS ModelBuilder or the ERDAS Spatial Modeler. With this plugin it is very easy to use your GRASS, SAGA and GDAL tools, self-written R scripts and many more. This makes spatial analysis much easier and increases reproducibility. Especially the combination with R functions provides a completely new dimension of working with a GIS as nearly everything spatially can be converted to a data.frame and be consumed by…
Shiny @RStudio: an analytical webapp
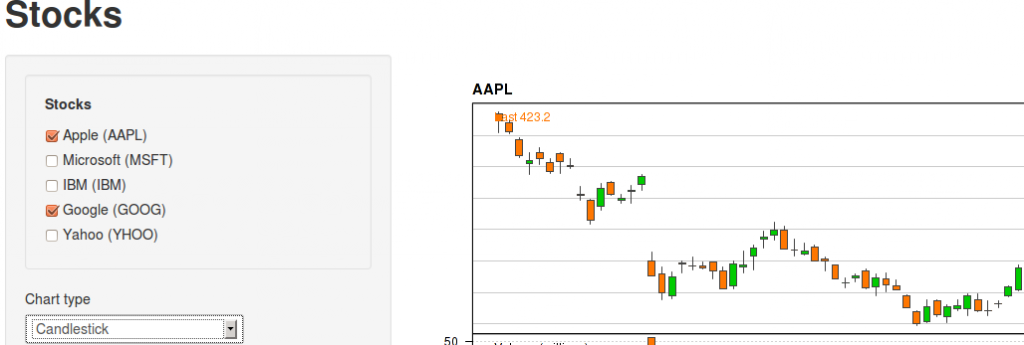
As i was preparing myself for getting funding for the trip to the R user conference this year in Albacete, Spain I was coming across a highlightning talk by Josh Paulson about an interactive way of using the power of R without real struggling with R as a programming language: Shiny is a cool webapp which lets the user control the application via some drop-down menus and buttons and R computes the result in the background and displays them as well on the webpage:
R as a calculator: a little introduction to Tcl/TK programming with R
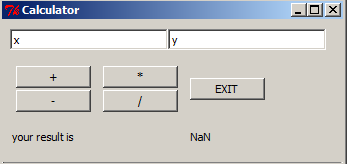
Due to an upcoming presentation about “what is R” and “what can I do with R” in my company I was playing around with GUIs as they are a very important way to interact with users and R to present a simple calculator. This will lead hopefully to an understanding of syntax and concepts in R:
plotting raster data in R: adjusting the labels and colors of a classified raster
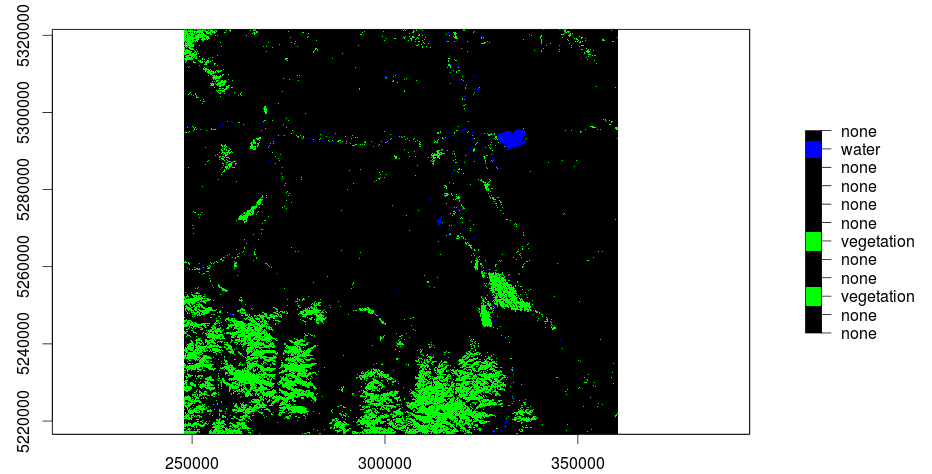
Thank’s to Andrej who wrote this comment: “Is it possible to to color the resulting 12 clusters within your original image to get a feel for visual separation?” You can do so:
unsupervised classification of a Landsat image in R: the whole story or part two
The main question when using remote sensed raster data, as we do, is the question of NaN-treatment. Many R functions are able to use an option like rm.NaN=TRUE to treat these missing values. In our case the kmeans function in R is not capable to use such a parameter. After reading the tif-files and creating of a layer stack we will go on with a work-around to solve the missing values problem of the non-covered areas of a Landsat picture.
unsupervised classification of a raster in R: the layer-stack or part one.
In my last post I was explaining the usage of QGis to do a layerstack of a Landsat-scene. Due to the fact that further research and trying out resulted in frustration I decided to stick with a software I know well: R. So download the needed layers here and open up your flavoured version of R (in my case RStudio).