Sentinel-2 is the optical satellite of the Copernicus programme. It can be compared to Landsat, although it has a better resolution, of 10 to 20 meters. We’ll be using it for crop monitoring with simple vegetation indices.
Overview
Sentinel-2 is the high-resolution optical satellite of ESA and the EU. The images have a resolution of 10 to 20 meters, higher than Landsat, and, as always with the Copernicus programme, the data are free and open.
In this tutorial, we’ll download an image, make it look good, and create maps of vegetation indices to show the general health of crops and other vegetation. This is a basic tutorial, but even for those with experience in remote sensing, it is a good starting point for working with Sentinel-2 data.
Getting the data and the tools
Although all Sentinel-2 data are available on the Copernicus data hub, they are also HUGE – 5 to 6 GB for an image. So in this tutorial we’re using a plugin in QGIS called
“Semi-automatic classification plugin”. It can download tiles of 100 by 100 km, instead of the entire image, plus it processes it for you, and has some nice other tools.
You can find a quick how-to on Youtube.
Open up QGIS, and under Plugins –> Manage and install plugins, search for the plugin name (“Semi-automatic classification plugin”), and install it. For me, the toolbar of this plugin appeared below the other toolbars in QGIS.

Visualize your image
Hover over the icons in the toolbar, and find the one that says “Tools” or “Semi-automatic classification plugin”. This will give you access to all the tools.
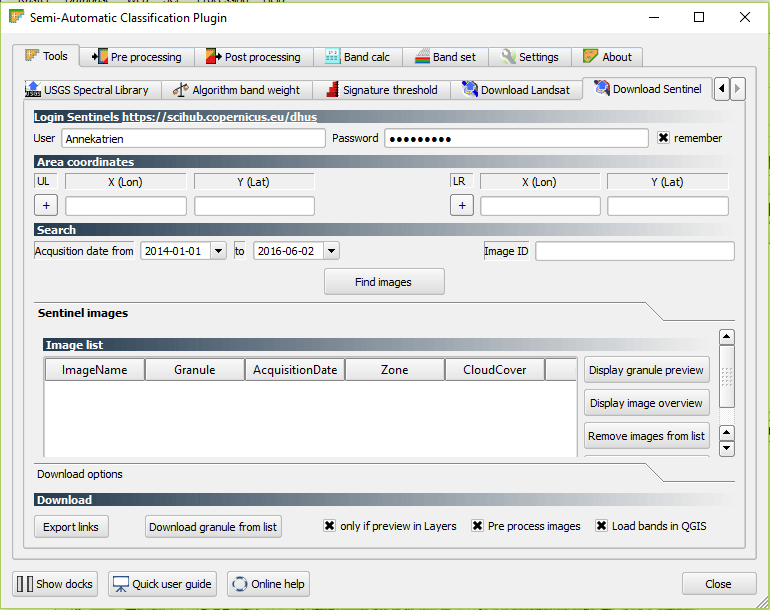
Go to the “Download Sentinel” tab, and follow along with the Youtube video, or do the following:
- Enter your login information that you use for the Sentinel hub.
- Press the PLUS sign under UL, and go to the map view in QGIS, and click on the upper left corner of your area of interest. Do the same for the lower right (LR) corner.
- Specify the time period you want to search images for.
- Click “Find Images”.
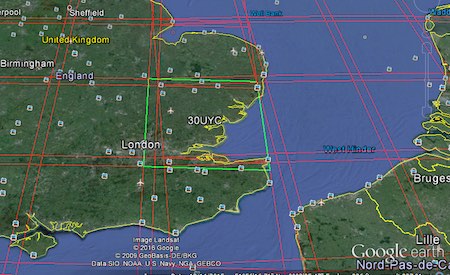
When the results return, all the granules (100x100km parts of the image) of an image covering your area of interest will be given. Play around with the “Display granule preview” to find the granule that covers your area of interest. When you’ve found it, select it, and click “Download granule from list”.
Be aware that “Pre process images” is ticked off in the lower right corner of the plugin window, so make sure to turn it off if you don’t want it preprocessed! For the purposes of this tutorial, I left it on.
When it’s done downloading, switch to the “Band Set” tab. Select band 2, 3, 4, 8A and 11, and click “Add rasters to set”. After you click “Create raster of band set (stack bands)”, the map in QGIS will display an RGB image:
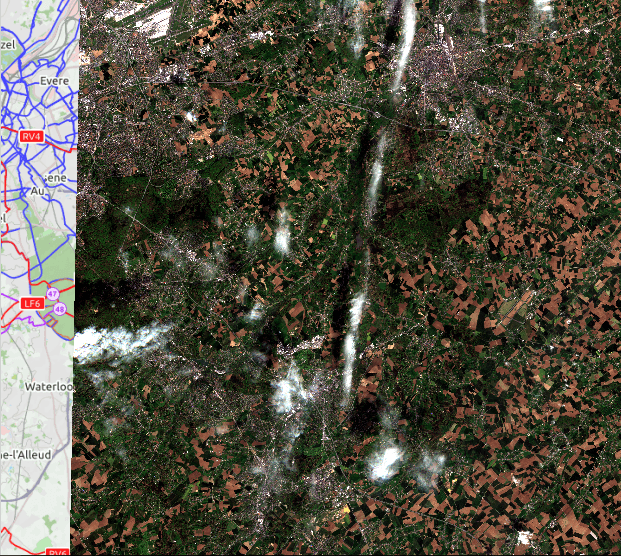
This is just to make it easier to work – you can skip this step if you prefer.
Calculate vegetation indices for crop monitoring
Let’s move on and get some information from the image! We’re going to calculate the Normalized Difference Vegetation Index (NDVI) and Normalized Difference Water Index (NDWI), to check the vitality of the crops, and their moisture content. If you want to learn more about the myriad of vegetation indices out there, check out this paper.
In the plugin, switch to the “Band calc” tab. If you’ve saved the image as a stack, the formula for NDVI is like in this figure:
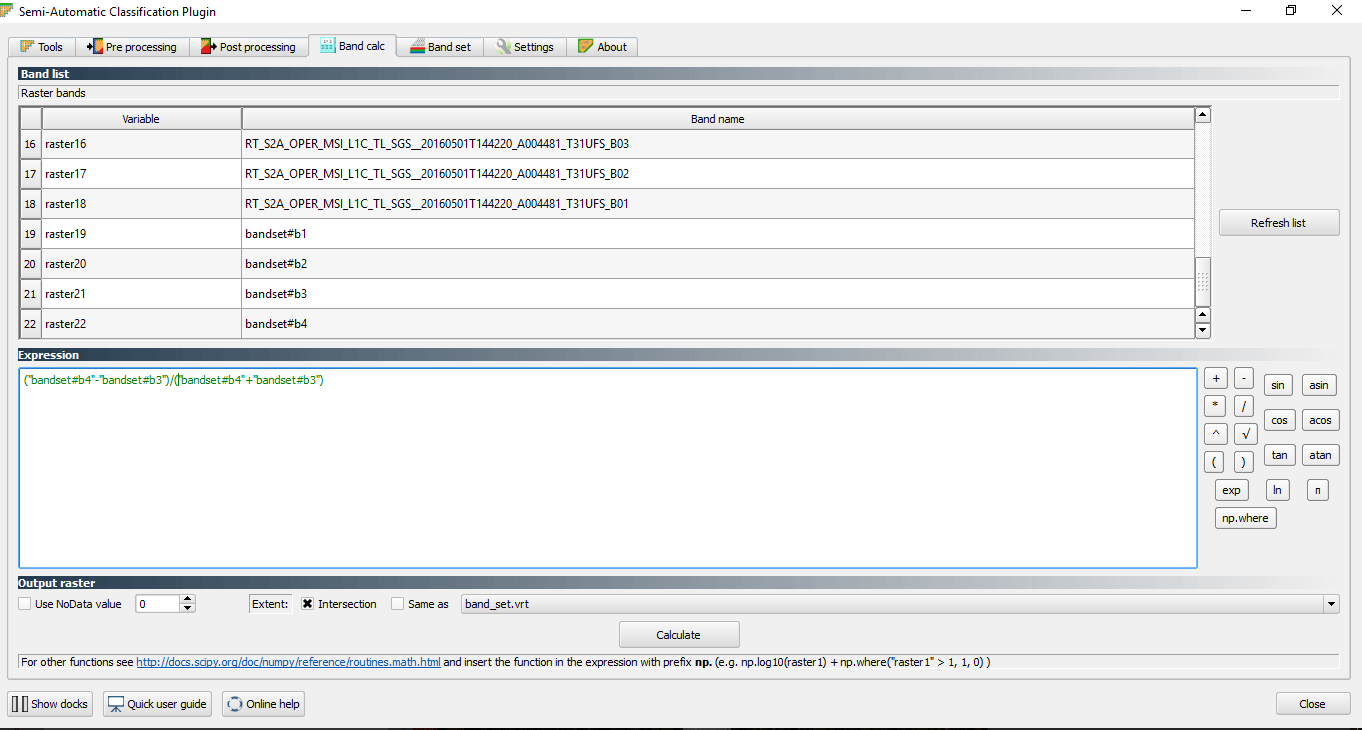
Otherwise, it is (Band8A-Band4)/(Band8A+Band4).
Press “Calculate”.
The result is displayed in grayscale.

To make the results easier to interpret visually, we’ll change the color palette.
Right-click on the NDVI image in the Layers panel on the left, and click “Properties”.

In the Style tab, choose “Singleband pseudocolor” as the Render type, tick off “Invert” in the Generate new color map box, and click “Classify” in the same box. Click “OK”.
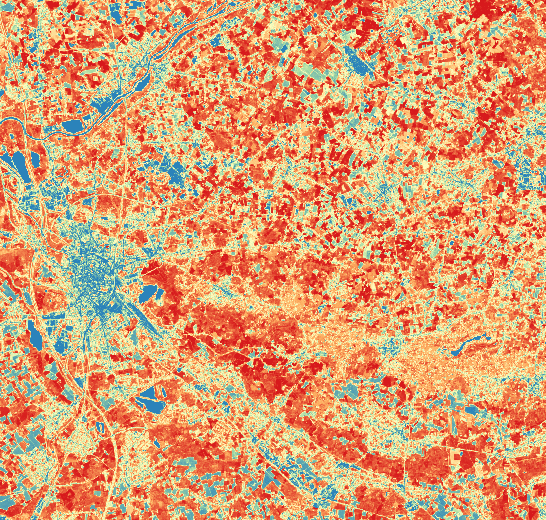
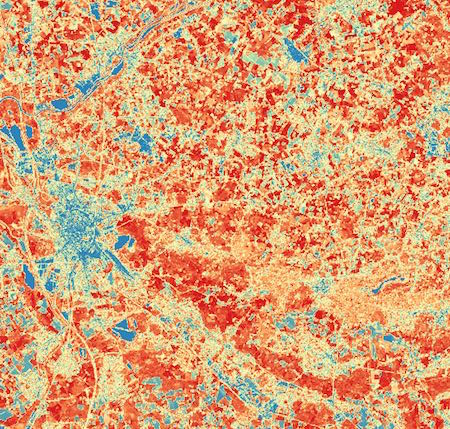
The NDVI image shows where vegetation is healthy and mature (red colors), while rivers and cities are shown in blue because of lack of vegetation. When you zoom in to a particular field, you can see variations in NDVI on the field, which indicates differences in crop health and maturity across the field. Farmers use this to finetune fertiliser spraying.
To get more information on what could be the problem, when faced with a lower than expected NDVI, you can use the NDWI, which will indicate drought stress in crops. This document shows how it is used for operational monitoring of European crops with the MODIS satellites.
To calculate the the NDWI from Sentinel-2, we’ll be using band 8A as the NIR band, and band 11 as the SWIR band. Otherwise, the calculation of the index is the same as that of the NDVI:
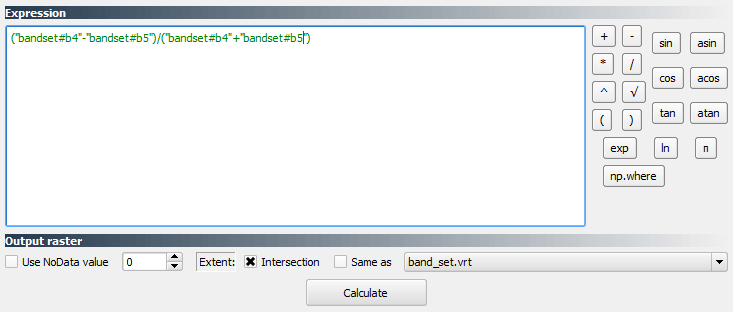
Or also: (Band 8A - band 11)/( band 8A + band 11)
Apply a pseudocolor palette to the NDWI results too.
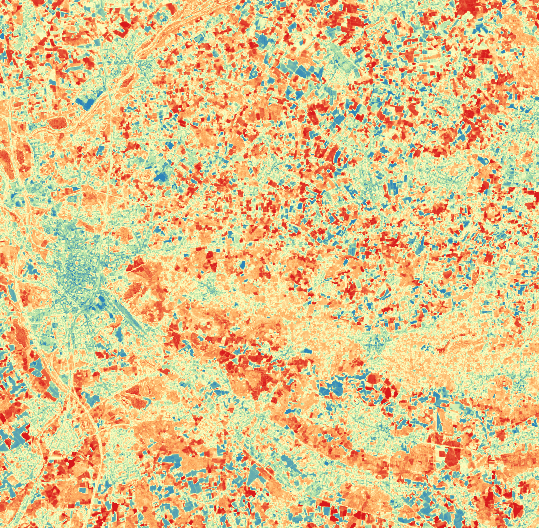
Higher NDWI values, shown as red colors, indicate high water content and high vegetation cover.
When we compare the NDVI to the NDWI, we can see where vegetation has a high density (red in NDVI results), but a low water content (yellow in NDWI).
Which vegetation indices do you usually use for crop monitoring?

Very nice Article, Annekatrien. I really love your input about sentinel
Thanks Simon!
Dear Annekatrien Debien
I hope you are doing well,
Please just I was wondering if is there any tutorial to make stack layer for multi sentinel 2 images.
Your reply will be highly appreciated.
Best Regards,
Afrah
Realy very nice, Annekatrien! I love your input about sentinel too. I’m curious about your next blog post.
Thanks Norbert!
Hello I am wondering is Band 8A 20 meters or 10 meters spatial resolution? I know that band 11 is 20 meter
Band 8A has a 10 meter resolution: https://earth.esa.int/web/sentinel/missions/sentinel-2/instrument-payload/resolution-and-swath
Ok, thanks for reference. I must say that reference is not current since 8a band in the most recent Sentinel 2 a download is 20 m resolution and 8a band is 8b in reference you mention. Thank you for helping me to clarify this, it will be useful to others
No, Band8A has 20 meter resolution.
Also, I am confused a little bit, in its original paper, Gao, B.-C. 1996. NDWI – A normalized difference water index for remote
sensing of vegetation liquid water from space. Remote Sensing of
Environment 58: 257-266., Gao is using 1240 nm but band 11 in Sentinel is 1610 nm. Can you explain it?
I based my formula on this document – http://edo.jrc.ec.europa.eu/documents/factsheets/factsheet_ndwi.pdf – in which they use MODIS band 6 as the SWIR band, which is around 1630 nm. It’s not perfect, so I wouldn’t use it without testing first, but it gives an indication.
I got it. Thank you
My Sentinels login seems OK but when I clicked on the “Find images” button :
Error [50]: Internet error:
Anyone have this trouble ?
Thanks — So
P.S. Tested with QGIS 2.14.3-Essen / OS X 10.11.5
Same here, same QGIS version on WIndows 10. Landsat dataset seem to be loading OK though.
Did you sort this? have the same problem
I’m getting the same error with QGIS 2.16.0. any solutions yet?
yip I’ll email it to you. Also we are looking at having a half day training course on sential at the end of forest tech. Sarah
I know this question is a bit old, but just in case it helps someone in the future, Luca posted a fix for this error and it worked for me:
http://fromgistors.blogspot.com/2016/06/sentinel-2-download-issues.html
Why did you used Band8A (red edge) instead of Band8 (NIR) for NDVI calculation?
Why did you used Band8A (red edge) instead of Band8 (NIR) for NDVI calculation? plz somebody ans it
Why did you used Band8A (red edge) instead of Band8 (NIR) for NDVI calculation?