The Initial Data
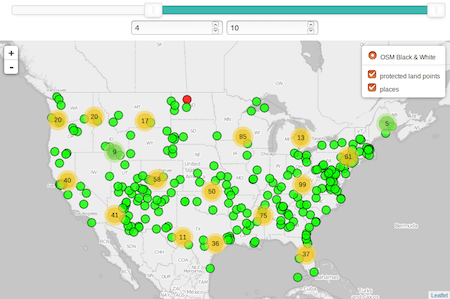
Let’s start with a very basic map. It consists of a point layer and a clustered layer which is on the same map. A simple example map looks like this:<!DOCTYPE html>
<html>
<head>
<title>leaflet basic example</title>
<meta charset="utf-8" />
<link rel="stylesheet" href="http://cdnjs.cloudflare.com/ajax/libs/leaflet/0.7.3/leaflet.css" />
<link rel="stylesheet" href="https://cdnjs.cloudflare.com/ajax/libs/leaflet.markercluster/0.5.0/MarkerCluster.Default.css" />
<script src="http://cdnjs.cloudflare.com/ajax/libs/leaflet/0.7.3/leaflet.js"></script>
<script src="https://cdnjs.cloudflare.com/ajax/libs/leaflet.markercluster/0.5.0/leaflet.markercluster.js"></script>
<script src="exp_popplaces.js"></script>
<script src="exp_ne10mparksandprotectedlandspoint.js"></script>
<meta name="viewport" content="initial-scale=1.0, user-scalable=no" />
<style>
body {
padding: 0;
margin: 0;
}
html, body, #map {
height: 100%;
}
</style>
</head>
<body>
<div id="map"></div>
<script>
var map = L.map('map', {
zoomControl:true, maxZoom:19
}).fitBounds([[-22.6665544576,-206.634809944],[100.520856024,-21.8536942211]]);
var basemap_0 = L.tileLayer('http://{s}.www.toolserver.org/tiles/bw-mapnik/{z}/{x}/{y}.png');
basemap_0.addTo(map);
function pop_prot(feature, layer) {
var popupContent = 'name: ' + String(feature.properties['unit_name']);
layer.bindPopup(popupContent);
}
function protecland_marker(feature, latlng) {
return L.circleMarker(latlng, {
radius: 8.0,
fillColor: '#11fe00',
color: '#000000',
weight: 1,
opacity: 1.0,
fillOpacity: 0.8
})
}
var protecland = new L.geoJson(exp_ne10mparksandprotectedlandspoint,{
onEachFeature: pop_prot,
pointToLayer: protecland_marker
});
protecland.addTo(map);
function pop_popplaces(feature, layer) {
var popupContent = 'name: ' + String(feature.properties['name']) + '<br>pop_max: ' + String(feature.properties['pop_max']);
layer.bindPopup(popupContent);
}
function popplaces_marker(feature, latlng) {
return L.circleMarker(latlng, {
radius: 8.0,
fillColor: '#ff0000',
color: '#000000',
weight: 1,
opacity: 1.0,
fillOpacity: 0.8
})
}
var popplaces = new L.geoJson(exp_popplaces,{
onEachFeature: pop_popplaces,
pointToLayer: popplaces_marker
});
var cluster_popplaces= new L.MarkerClusterGroup({showCoverageOnHover: false});
cluster_popplaces.addLayer(popplaces);
cluster_popplaces.addTo(map);
var baseMaps = {'OSM Black & White': basemap_0};
controler = L.control.layers(baseMaps,{"places": cluster_popplaces,"protected land points": protecland},{collapsed:false}).addTo(map);
</script>
</body>
</html>
Used example files can be found here and here.
The places have a field called pop_max which I will use to filter! In the second step I will change the filter attribute and show the example for the non clustered protected land points.
Overall this will be a 3 step process:
- create the slider/input fields in html
- connect those with the map
- change for non clustered points
The Slider and the Inputs
I am working in this example with the noUiSlider: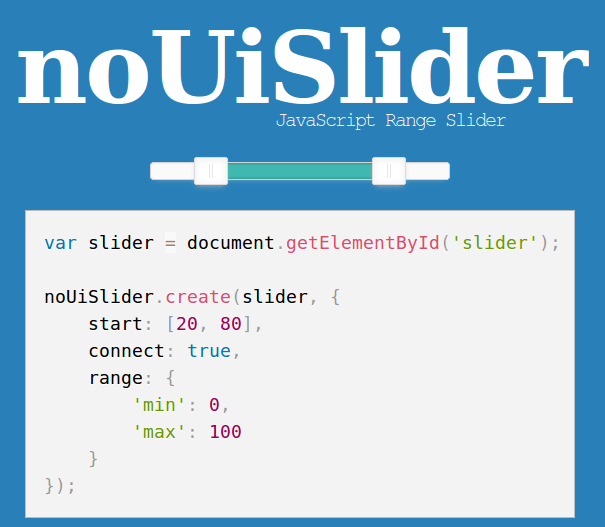
<div id="slider" style="top: 0px; right: 1px; margin: 10px 25px;"></div>
<div style="margin-right: auto; margin-left: auto; width: 90%; margin-bottom: 10px; text-align: center;">
<input type="number" min='1' max='35675999' id="input-number-min">
<input type="number" min='2' max='35676000' id="input-number-max">
</div>
Make sure, you’ve added the src files for the js and css in your head of the html file:
<link rel="stylesheet" href="https://cdnjs.cloudflare.com/ajax/libs/noUiSlider/8.5.1/nouislider.min.css" />
<script src="https://cdnjs.cloudflare.com/ajax/libs/noUiSlider/8.5.1/nouislider.min.js"></script>
As I have now all the “magic” available I will create the slider inside our div:
var slidervar = document.getElementById('slider');
noUiSlider.create(slidervar, {
	connect: true,
	start: [ 1, 35676000 ],
	range: {
		min: 1,
		max: 35676000
	}
});
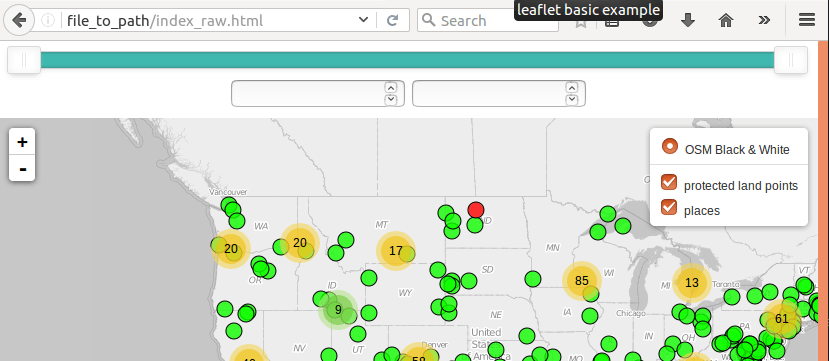
Now there is a nice slider:
document.getElementById('input-number-min').setAttribute("value", 1);
document.getElementById('input-number-max').setAttribute("value", 35676000);
Yet there is something more to do. I also need the possibility to update the slider via the input fields:
var inputNumberMin = document.getElementById('input-number-min');
var inputNumberMax = document.getElementById('input-number-max');
inputNumberMin.addEventListener('change', function(){
	slidervar.noUiSlider.set([this.value, null]);
});
inputNumberMax.addEventListener('change', function(){
	slidervar.noUiSlider.set([null, this.value]);
});
Connect Slider with the Data to Filter
Until now, the slider stands for himself and works with the input fields. Now I will connect the values in th input fields with the slider so the fields are updated with the movement of the slider. Those values will also be used as the min and max values of the filter.
slidervar.noUiSlider.on('update', function( values, handle ) {
	//handle = 0 if min-slider is moved and handle = 1 if max slider is moved
	if (handle==0){
		document.getElementById('input-number-min').value = values[0];
	} else {
		document.getElementById('input-number-max').value =  values[1];
	}
//we will definitely do more here...wait
})
This will show the current values from the slider in the input fields.
I need to update the layers and filter the underlying json. For filtering purpose it’s handy to get the min/max value in a distinct variable:
rangeMin = document.getElementById('input-number-min').value;
rangeMax = document.getElementById('input-number-max').value;
I will remove the current filtered layer from the map and reload it after the slider was updated with the filtered layer:
//first let's clear the layer:
cluster_popplaces.clearLayers();
//and repopulate it
popplaces = new L.geoJson(exp_popplaces,{
	onEachFeature: pop_popplaces,
		filter:
			function(feature, layer) {
				 return (feature.properties.pop_max <= rangeMax) && (feature.properties.pop_max >= rangeMin);
			},
	pointToLayer: popplaces_marker
})
//and back again into the cluster group
cluster_popplaces.addLayer(popplaces);
And now it’s done and works like a charm!Change for non Clustered Points
The adoption for non clustered points is quite easy: Instead of treating the non clustered layer itself I packed it into a featureGroup and this makes it to work like with the cluster by removing the layer from the featureGroup by clearLayers(), creating the filtered version and adding it back to the featureGroup. Here is the example:Keep in mind that I also changed the input settings to accept integers only as we filter on integer values.
Thank you for the tutorial, that’s exactly what I was looking for!