For an upcoming project I was curious about visualizing a line layer using OpenLayers. Therefore I digitized a way with googlemaps. After creating a kml with “my places” in googlemaps I exported the coordinates to libre office calc and converted them to fit the needed code in OpenLayers:
new OpenLayers.Geometry.Point(-5.106282, 56.820473 ),
This will be the basis for our ongoing tutorial.
First off all: keep in mind that you will need a good basemap for displaying vectors especially routes/ways. Therefore I will add a googlemap basemap and as a comparison an OpenStreetMap WMS using this:
var google = new OpenLayers.Layer.Google(
"Google Hybrid",
{type: google.maps.MapTypeId.HYBRID, numZoomLevels: 20}
);
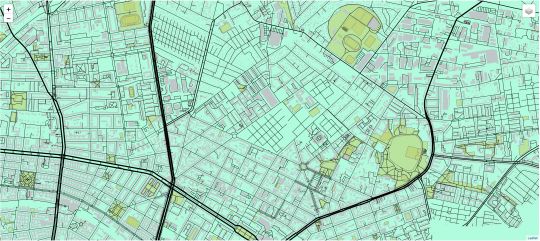
var osm = new OpenLayers.Layer.OSM();
Now we have two variables called google and osm to represent our basemap.
As you may know, a line vector is build up by so called vertices and each of them is a point for itself. So instead of adding multiple points we need to create a list of points (minimal example):
var points = new Array(
new OpenLayers.Geometry.Point(-5.094953, 56.825886),
new OpenLayers.Geometry.Point(-5.093430, 56.826069),
new OpenLayers.Geometry.Point(-5.089990, 56.827290)
)
That’s where the Excel-file comes into play 😉
And you need something like a container for all the points which is another variable called vector whith the label “trip”:
var vector = new OpenLayers.Layer.Vector("trip", {style: sm});
You may have noticed the {style: sm} which is unknown. So you need to define a style for line beforehand. The style will be blue (#0000ff) with a width of 5 and only 50% opacity:
var sm = {strokeColor: '#0000ff',
		  strokeOpacity: 0.5,
		  strokeWidth: 5 };
Now there is a another problem. The coordinates given by googlemaps are WGS 84 coordinates which corresponds to EPSG:4326. Googlemaps as well as OSM operates on the Spherical Mercator Projection EPSG:900913. Of course you can reproject your locations. We combine that with adding the points to our container:
vector.addFeatures([new OpenLayers.Feature.Vector(new OpenLayers.Geometry.LineString(points).transform(new OpenLayers.Projection("EPSG:4326"), new OpenLayers.Projection("EPSG:900913")))]);
And lets do the last steps as you have seen them already. The last step sets the zoom extent with new coordinates and the zoom level (10 in this case):
//Add the google map layers
        map.addLayers([vector, google_hybrid,ol]);
// Add a layer switcher control
	map.addControl(new OpenLayers.Control.LayerSwitcher({}));
// Zoom the map to the max extent
        map.setCenter(new OpenLayers.LonLat(-5.08,56.82).transform(new OpenLayers.Projection("EPSG:4326"), new OpenLayers.Projection("EPSG:900913")), 10);
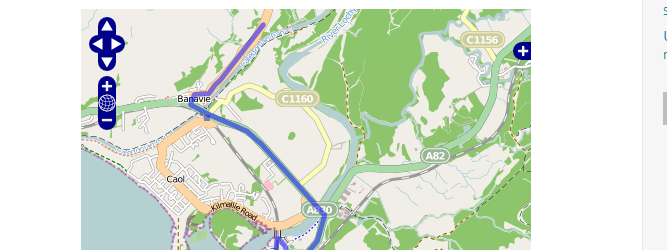
Let us have a look:
You can download the whole html file HERE. There is a little additional text embedded in the html as it adds a workaround to get away with annoying pop-ups.