Basemaps are a web cartographers best friend, aren’t they. There are plenty of them online, ready to be embedded in your upcoming nice web map application. In this article we will publish our own basemap…. But this time: Vectorstyle!
The classic basemap is a set of PNG/JPG files that are in a specific order (for xyz-tiles). To create a classic basemap for the use you need to spend some time in creating/styling a nice map inside the GIS of your choice. Then you will render the tiles. Depending on the different scales your will render these files for quite some time (we are talking hours/days/weeks here!). Taking this into account, changing or updating a basemap is hell of a game!
Vector Maps
Vector maps come in handy here. The application of the style will be done on the client side and the only processing that you need to take care of is exporting the vetcor data into a format the client can understand. In this tutorial we will:
- grab data from OSM
- display the data in QGIS
- export the data into pbf
- style the layer in leaflet
This will enable you to publish your own custom basemaps or start a new Etsy business.
Getting the data
For our example we will use the quickOSM plugin for/in QGIS.
To get the right data I am exporting first boundaries of my area of interest and remove all other features:
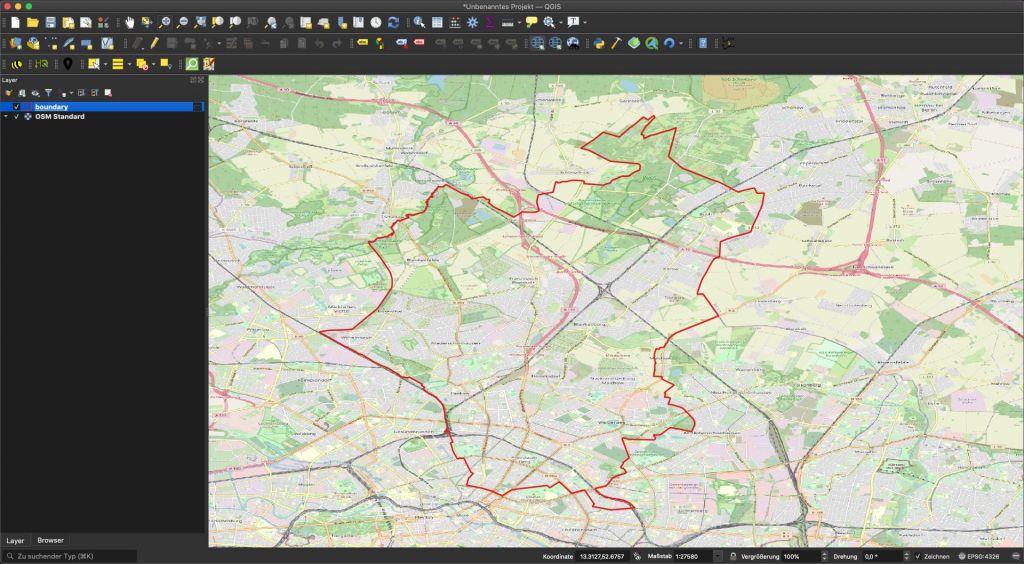
We will use this polygon layer for the extraction of three additional layers:
- buildings
- highways (OSM name for “streets”)
- parks
Prior export, we should make sure to decrease the size of the data by getting rid of all attributes that might not be relevant for styling. An example: I will govern the style of the streets only using the highways attribute (“primary”,”secondary” and “tertiary”). I am removing all other streets and all other attributes that are not needed for styling. You should prepare all layers this way as it will reduce the file size which will result in faster loading of the vector map.
Please avoid the direct export: some of the OSM data might be crooked, so make sure to run the “fix geometries” algorithm on all your layers!
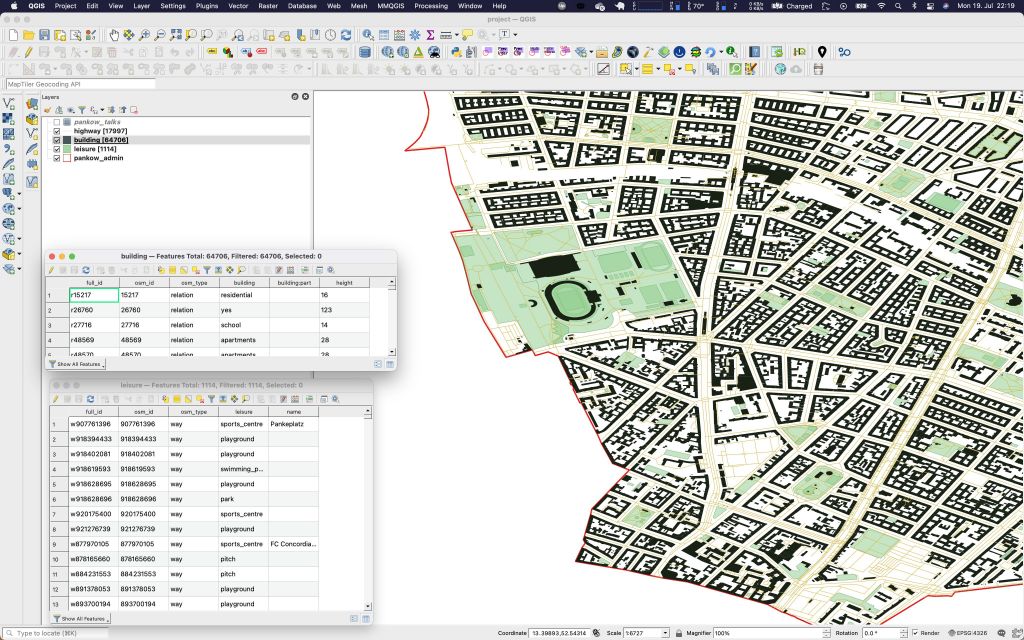
After cleaning up your data, save it as a geojson. Still keep in mind: reduce the number of decimals in your coordinate precission as low as possible.
Export GeoJSON to pbf
Once you’ve saved all layers you need for your basemap as geojson we will use Tippecanoe for creating the tile map scheme we’re used to with raster basemaps but we will export our layers as so called protobuf files (PBF is the file format) . We will consume these files directly in QGIS and with leaflet.
Tippecanoe is easy to install on mac as well as Ubuntu. The export with Tippecanoe can be customized quite a lot and you can play around with dozens of parameters according to the documentation from Mapbox.
My export was a very basic one as I am a simple guy. I am exporting my layers with this command:
tippecanoe -pk -pC -P -an -z17 -Z11 -e vector_tiles --extend-zooms-if-still-dropping
       buildings.GeoJSON highways.GeoJSON leisure.GeoJSON  --force*/
- -pk: no size limit
- -pC: no compression
- -z17 – Z11 zoom 11-17
- -e to folder “builds”
- –extend… Mapbox tells us: If even the tiles at high zoom levels are too big, keep adding zoom levels until one is reached that can represent all the features
This command result in a set of folders (each zoom level has a folder) with subfolders and properties file at root that stores some meta information.
As I am running this on a mac, I was surprised (I was not testing Ubuntu): It has full core support and it will kick off all your cores… the whole export only took about 1min to create approx 4400 files.
Consuming the vector data
As a result we can consume the resulting folder with QGIS already but we are looking more at the leaflet part of the story.
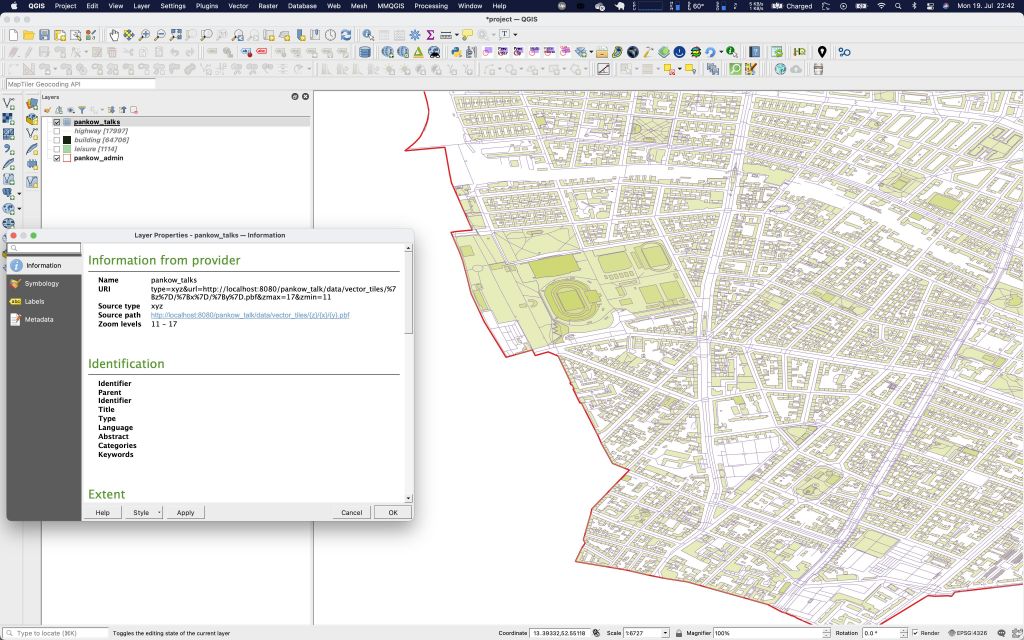
I am using the VectorGrid plugin to style the pbf files in leaflet. This will allow me to cunsumr protobuf in the famous z/x/y style. But there is a disadvantage with the current version of this plugin: it does not allow to control the order of your layers to be visualized in leaflet, so we need to adjust the verison on your local copy as described here.
The basic setup is comparable to any other leafelt webmap:
- create a map container
- add a layer using the VectorGrid plugin
- apply some rules for styling
<!DOCTYPE html>
<html>
<head>
    <title>Vector styles basemap</title>
    <meta charset='utf-8' />
    <meta name='viewport' content='width=device-width, initial-scale=1.0'>
    <link rel='shortcut icon' type='image/x-icon' href='docs/images/favicon.ico' />
    <link rel='stylesheet' href='https://unpkg.com/leaflet@1.7.1/dist/leaflet.css' />
    <script src='https://unpkg.com/leaflet@1.7.1/dist/leaflet.js'></script>
    <script src='https://cdnjs.cloudflare.com/ajax/libs/leaflet-hash/0.2.1/leaflet-hash.min.js'></script>
    <script src='Leaflet.VectorGrid.bundled.js'></script>
    <style>
        body {
            padding: 0;
            margin: 0;
        }
        html, body, #mapid {
            height: 100%;
            width: 100%;
            background: pink; /* just to get good contrast*/
        }
    </style>
</head>
<body>
    <div id='mapid'></div>
    <script>
var map = L.map('mapid').setView([52.54902, 13.42455], 16);
        var hash = new L.Hash(map);
    </script>
</body>
</html>
As we have the map now up and running with a piggy-pink background color, let’s add the first layer. Please remember, that we have exported the vector data only up to zoom level 17…
var myLayer = L.vectorGrid.protobuf('http://localhost:8080/pankow_talk/data/vector_tiles/{z}/{x}/{y}.pbf', {
            maxZoom: 20,
            maxNativeZoom: 17,
            minZoom: 11,
            vectorTileLayerStyles: {
                //////////////////////////////////////
                // simple style                     //
                //////////////////////////////////////
                leisure: function (properties, zoom) {
                    return {
                        fillColor: "#becf50",
                        opacity: 1,
                        fillOpacity: 0.5,
                        weight: 1,
                        color: "grey",
                        fill: true,
                        zorder: 1
                    }
                },
                ///////////////////////////////////////
                // we need zoom !!!                  //
                ///////////////////////////////////////
                building: function (properties, zoom) {
                    zoom2 = map.getZoom();
                    var color, weight;
                    if (zoom2 >= 16) {
                        color = "grey";
                        weight = 1;
                    }
                    if (zoom2 >= 18) {
                        color = "grey";
                        weight = 0.5;
                    }
                    return {
                        fillColor: "#bfc7c8",
                        opacity: 1,
                        fillOpacity: 1,
                        weight: weight,
                        color: color,
                        fill: true,
                        zorder: 2
                    }
                },
                //////////////////////////////////////
                // properties! we need properties!  //
                //////////////////////////////////////
                highway: function (properties, zoom) {
                    var weight;
                    if (properties.highway == "primary" || properties.highway == "motorway") {
                        weight = 4;
                    }
                    else if (properties.highway == "secondary") {
                        weight = 2;
                    }
                    else {
                        weight = 1;
                    }
                    return {
                        opacity: 1,
                        weight: weight,
                        color: "black",
                        zorder: 3
                    }
                },
            }
        }).addTo(map);
We are overzooming our layers. If you will not correct the styles at each overzoomed layer, the lines will double their thickness, so we are correcting this by a new rule for every zoom level. Furthorme we can style according to feature attributes as in the streets layer. with the zorder attribute you can govern the z-index of a layer in your basemap.
YOu might ask yourself, why is there a zoom2. Unfortunately I saw some issues with the overzooming. So I decided to call a layer redraw fro each zoom-in/zoom-out to get the target zoom level and apply the right style:
map.on('zoomend', function () {
    myLayer.redraw();
})
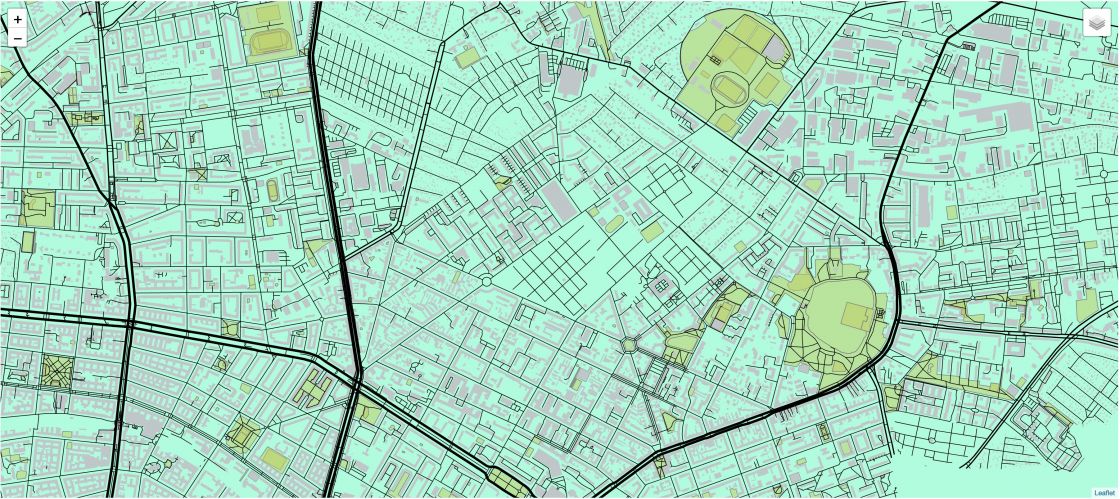
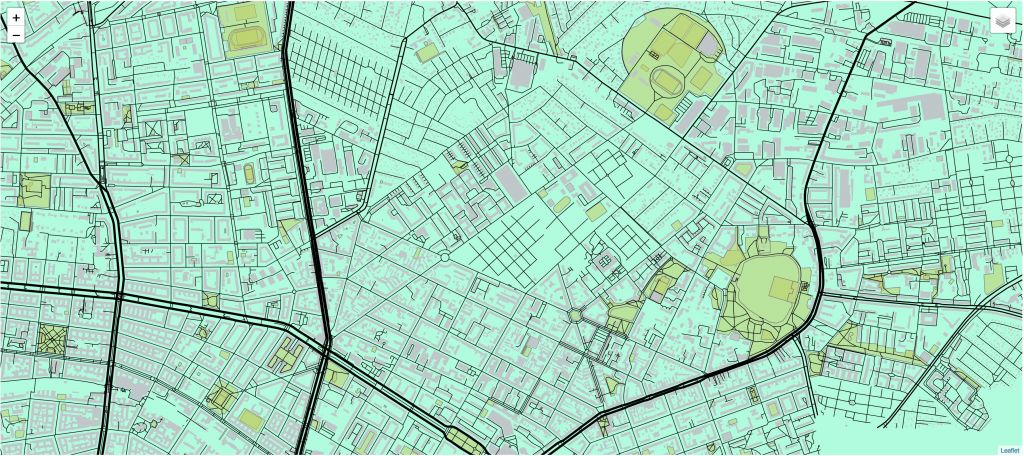
The resulting basemap:
If you want to play around with the source: Here is the zip.
No QGIS-server or ArcGIS server nor Geoserver was harmed in the making of this tutorial 😉

[…] Source link […]
Thank you very much for this tutorial, it helped me to understand how to categorize by feature properties 🙂
Great! That worked – thanks for sharing, Riccardo