
Test Data
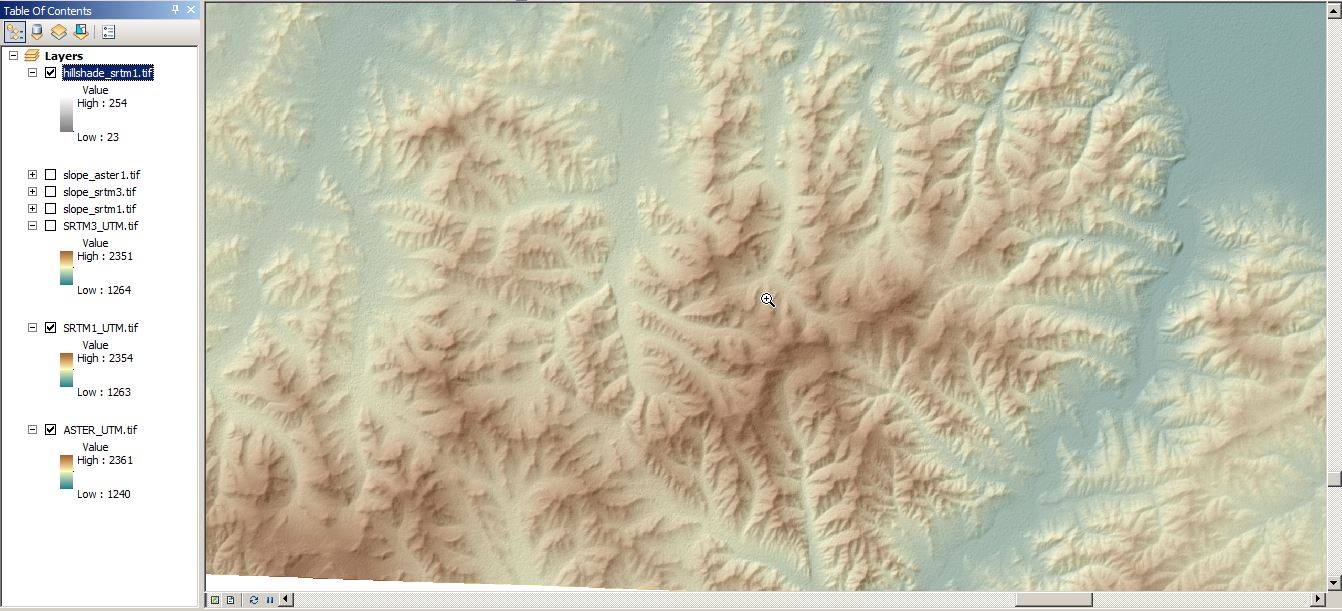
For this short insight in this approx. 30m resoluted DEM I’ve downloaded the path 134 row 27 data which corresponds to my lovely central Mongolian work area as used here and here. So I’ve just downloaded the STRM 1 dataset and added it to my project together with the ASTER DEM and the old SRTM 3 dataset:
To calculate slope and curvatures I reprojected the raster to fit EPSG 32648 which is UTM 48N based on WGS 84 using the the toolbox (ArcToolbox –> Data Management Tools –> Projections and Transformations –> Raster –> Project Raster). Having the same units for x,y and z I am now able to calculate slope to indicate some strange artefacts. These artifacts can be seen as well, looking at the second derivative of the DEM called curvature. Especially breaklines are visible in curvature analysis.
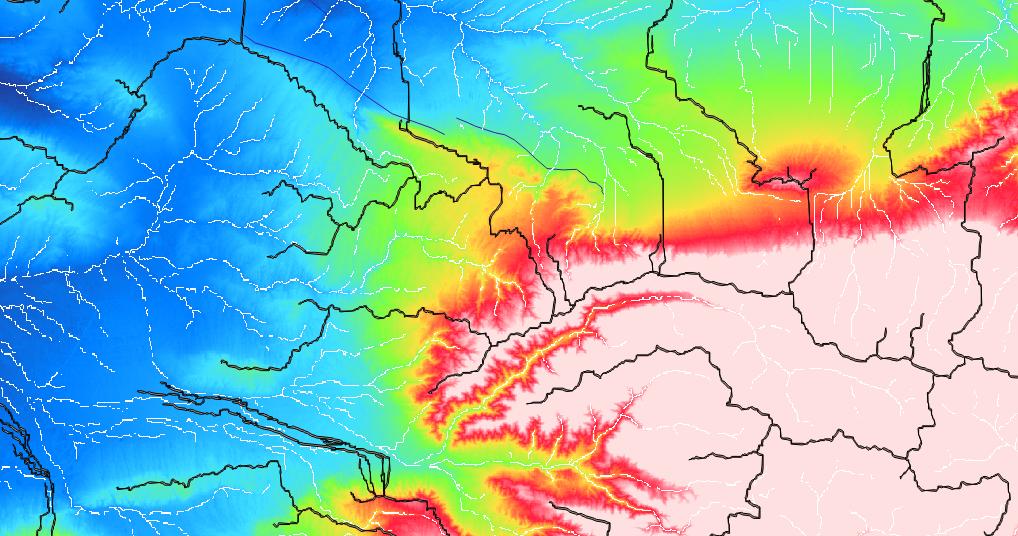
Slope
Due to the same principles behind the data gathering process of SRTM3 and SRTM1 we might expect similar overall results. But what was surprising: I’ve no missing values in the whole DEM and I was expecting much more holes as I had them in the first SRTM3 files I was working with some years ago.
The results of slope calculation (3D Analyst Tools –> Raster Surface –> Slope) was not showing any clearly visible artefacts and the topography was of course much more detailed. After using a basemap with satellite images and made a transparent overlay I was happy to know that this detailed data is out there and free of use for everyone:
Curvature
Also the curvature raster wasn’t showing noticeable artefacts:
Curvature can be calculated using the tool 3D Analyst Tools –> Raster Surface –> Curvature.
I am excited about this new dataset and I hope you have similar results: A great dataset with reliable height information.

Sigh. The data gap equals exactly the part of the world which is the most interesting in terms of tectonic geomorphology.