Let’s get ready to rumble! No, just kidding. We are all excited about the recent message from the white house: SRTM “1” (1 equals 1 arcsecond, whereas 3 was indicating the 3 arcsecond a.k.a. 90m DEM) or the official title SRTM-2 will be available for free in the next months (orig. here, dg here). So why is it so important? Most DEM-interested people will answer: “Use the ASTER DEM if you need 30m!”. But let us have a closer look on both systems and how they perform.
The ASTER DEM
The ASTER DEM was a side product of the ASTER sensor which, on board of the TERRA satellite, takes stunning images of the Earth with 14 different bands ranging from ultraviolet to infrared. Due to this wide range the ground resolution depends but ranges from 15 to 90m. Taking stereo-images enables a remote sensing expert to create a digital elevation model. This is the same as we do with our eyes: We see the same thing from two different angles and we are able to determine its depth-difference and live and arrange ourselves in a 3D world.
The first version of the DEM was crap. Especially in cloudy areas you had strange artefacts so it was nearly impossible to work with this DEMs .See a little comparison here.
But we have now the second version of ASTER and the Jet Propulsion laboratory states:
The improved GDEM V2 adds 260,000 additional stereo-pairs, improving coverage and reducing the occurrence of artifacts. The refined production algorithm provides improved spatial resolution, increased horizontal and vertical accuracy, and superior water body coverage and detection. The ASTER GDEM V2 maintains the GeoTIFF format and the same gridding and tile structure as V1, with 30-meter postings and 1 x 1 degree tiles.
Nice to know! So this is our first candidate:
- 30m at ground solution
- passive system
- from 83° north latitude to 83° south
- released 2011
- free download with an ECHO/REVERB account via FTP pull
- still active
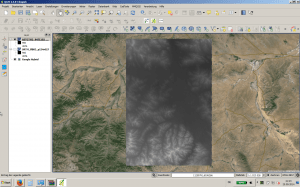
Our example scene:
The SRTM 3 DEM
SRTM or the Shuttle Radar Topography Mission was started 1999 onboard the Endeavour and collected data for 11 days. As the orbit of the shuttle was not circumpolar but sinusoidal it was only possible to cover a small portion of the earth surface. The shuttle therefore used the reflection of emitted radar signals in the so-called C-band (wavelength 5.6 cm) for the SIR-C sensor developed by the Jet Propulsion Laboratory and the X-band (wavelength 3.1 cm) for the X-SAR sensor developed by the German Aerospace Agency. The mission was clear: map the world!
So where are the differences? The X-band is more or less reflected on quite small objects due to the shorter wavelength. SO it was already scattered and therefore reflected at canopy cover as well. The C-band data was better for canopy cover penetration and was more or less reflected at the ground. So if you would like to get great DSMs (digital surface model) ask the DLR guys, for DTMs (digital terrain model) go to the JPL guys.
The logic behind the data (in short) is the calculation of return times of the signal scatter as it takes some time for the signal to reach the ground and to come back again: It was reflected faster by mountains then by beaches…
The main problem was that there were areas in the world (mountains for instance) which reflected so few energy to the sensor or scattered the signal so much, that the returning energy at the sensor was not enough to differentiate between noise and signal (see signal-to noise ratio ). The resulting DEMS had a lot of NAN values in it. They made some improvements and the last version for my special area is an interpolated and “finished” version with filling algorithm.
Nice to know! So this is our second candidate:
- 90m at ground worldwide
- active system
- from 60° north latitude to 58° south
- acquired 2000 /different releases
- free download without registering
- once acquired, source data hasn’t changed
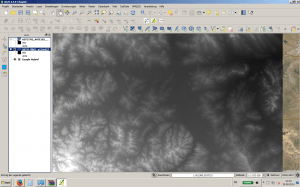
Our sample scene:
The Area For Our Contestants
My old main research area: welcome to central Mongolia. flat plains, mountain ranges, steppe vegetation patterns along with forests in the mountains. We are located near the “city” of Kharkhorin in the north-eastern parts of the Khangai mountain range. I’ll concentrate on a fan that was build up by the Orkhon river. It is sparsely vegetated and accompanied by a recently build road.
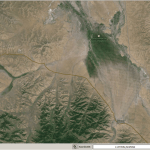
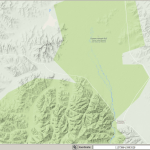
You might get an idea looking at the Google background served by the OpenLayers plugin:
The Test
First lets check the absolute differences between the two datasets. It might be known to you that the relative height error of SRTM data is about 16m. So see the differences here. I’ve used the raster calculator of QGIS to calculate the absolute difference between the pixels. I must admit that I needed to project the ASTER DEM to the UTM projection defined at zone 48N. The syntax for the projection was:
gdalwarp -overwrite -s_srs EPSG:4326 -t_srs EPSG:32648 -r bilinear -of GTiff C:\Users\rikl\Downloads\ASTGTM2_N47E102_dem.tif C:/Users/rikl/Downloads/ASTGTM2_N47E102_dem_UTM.tif
The syntax for the raster calculator:
sqrt ( ( "ASTGTM2_N47E102_dem_UTM@1" - "SRTM_ffB03_p134r027@1" ) ^ 2)</blockquote>
And see the results. Something was definitely going wrong on this fan.
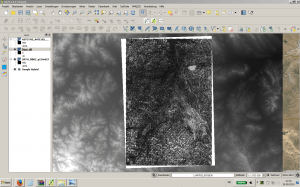
Now lets check what causes the errors. As you might have seen, the data in the ASTER GDEM looks a little bit noisy. Yet we haven’t done the math and this “noise” might result from our black-white color stretch. Best way to get insight: grab some pixel values using a profile tool. In my case I was using qprof which is a plugin for QGIS from Mauro Alberti, Marco Zanieri.
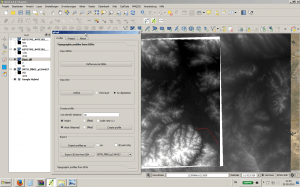
The plugin needs the information which layer it should check and you must create a profile line as well as you must define a distance which the tool uses to extract values along the line.
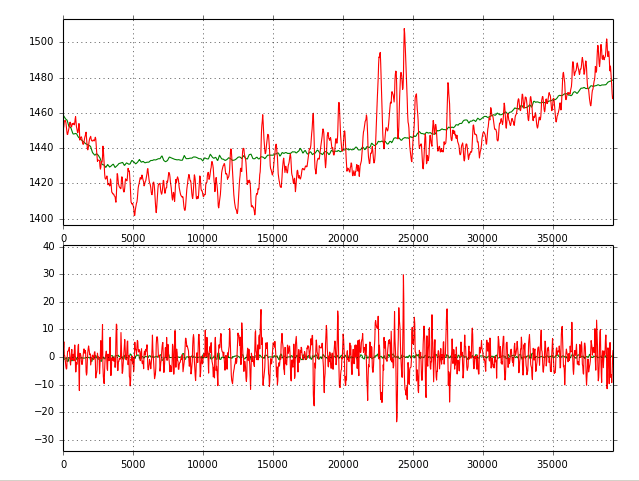
I’ve made a profile crossing the fan which is quite flat.
Get an insight into the area looking at the photo from my colleague Dr. Christoph Grützner :

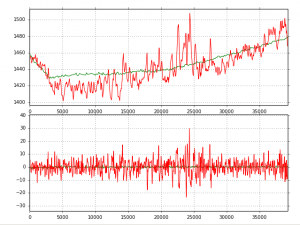
So I’ve extracted the height value of the SRTM in green and the one from ASTER GDEM in red. Additionally you can see slope values in the same colors:
I am interested in your evaluation of JAXA’s newly released ALOS World 3D arc second data (AW3D30) produced from averaging and subsampling the 5m resolution DSM derived from PRISM data. ftp://ftp.eorc.jaxa.jp/pub/ALOS/ext1/AW3D30/N045E100_N050E105.tar.gz
Announcement: http://global.jaxa.jp/press/2015/05/20150518_daichi.html
This dataset is great!!! ALOS rocks, unfortunately it is not available worldwide… https://digital-geography.com%20.www378.your-server.de/diggeo/comparing-alos-global-digital-surface-model-alos-world-3d-30m-with-srtm-1/#.VhbVOyt_89s
Now that SRTM v3 is out in 30m (for most of the world) have you done a similar comparison with ASTER 2?
great analysis