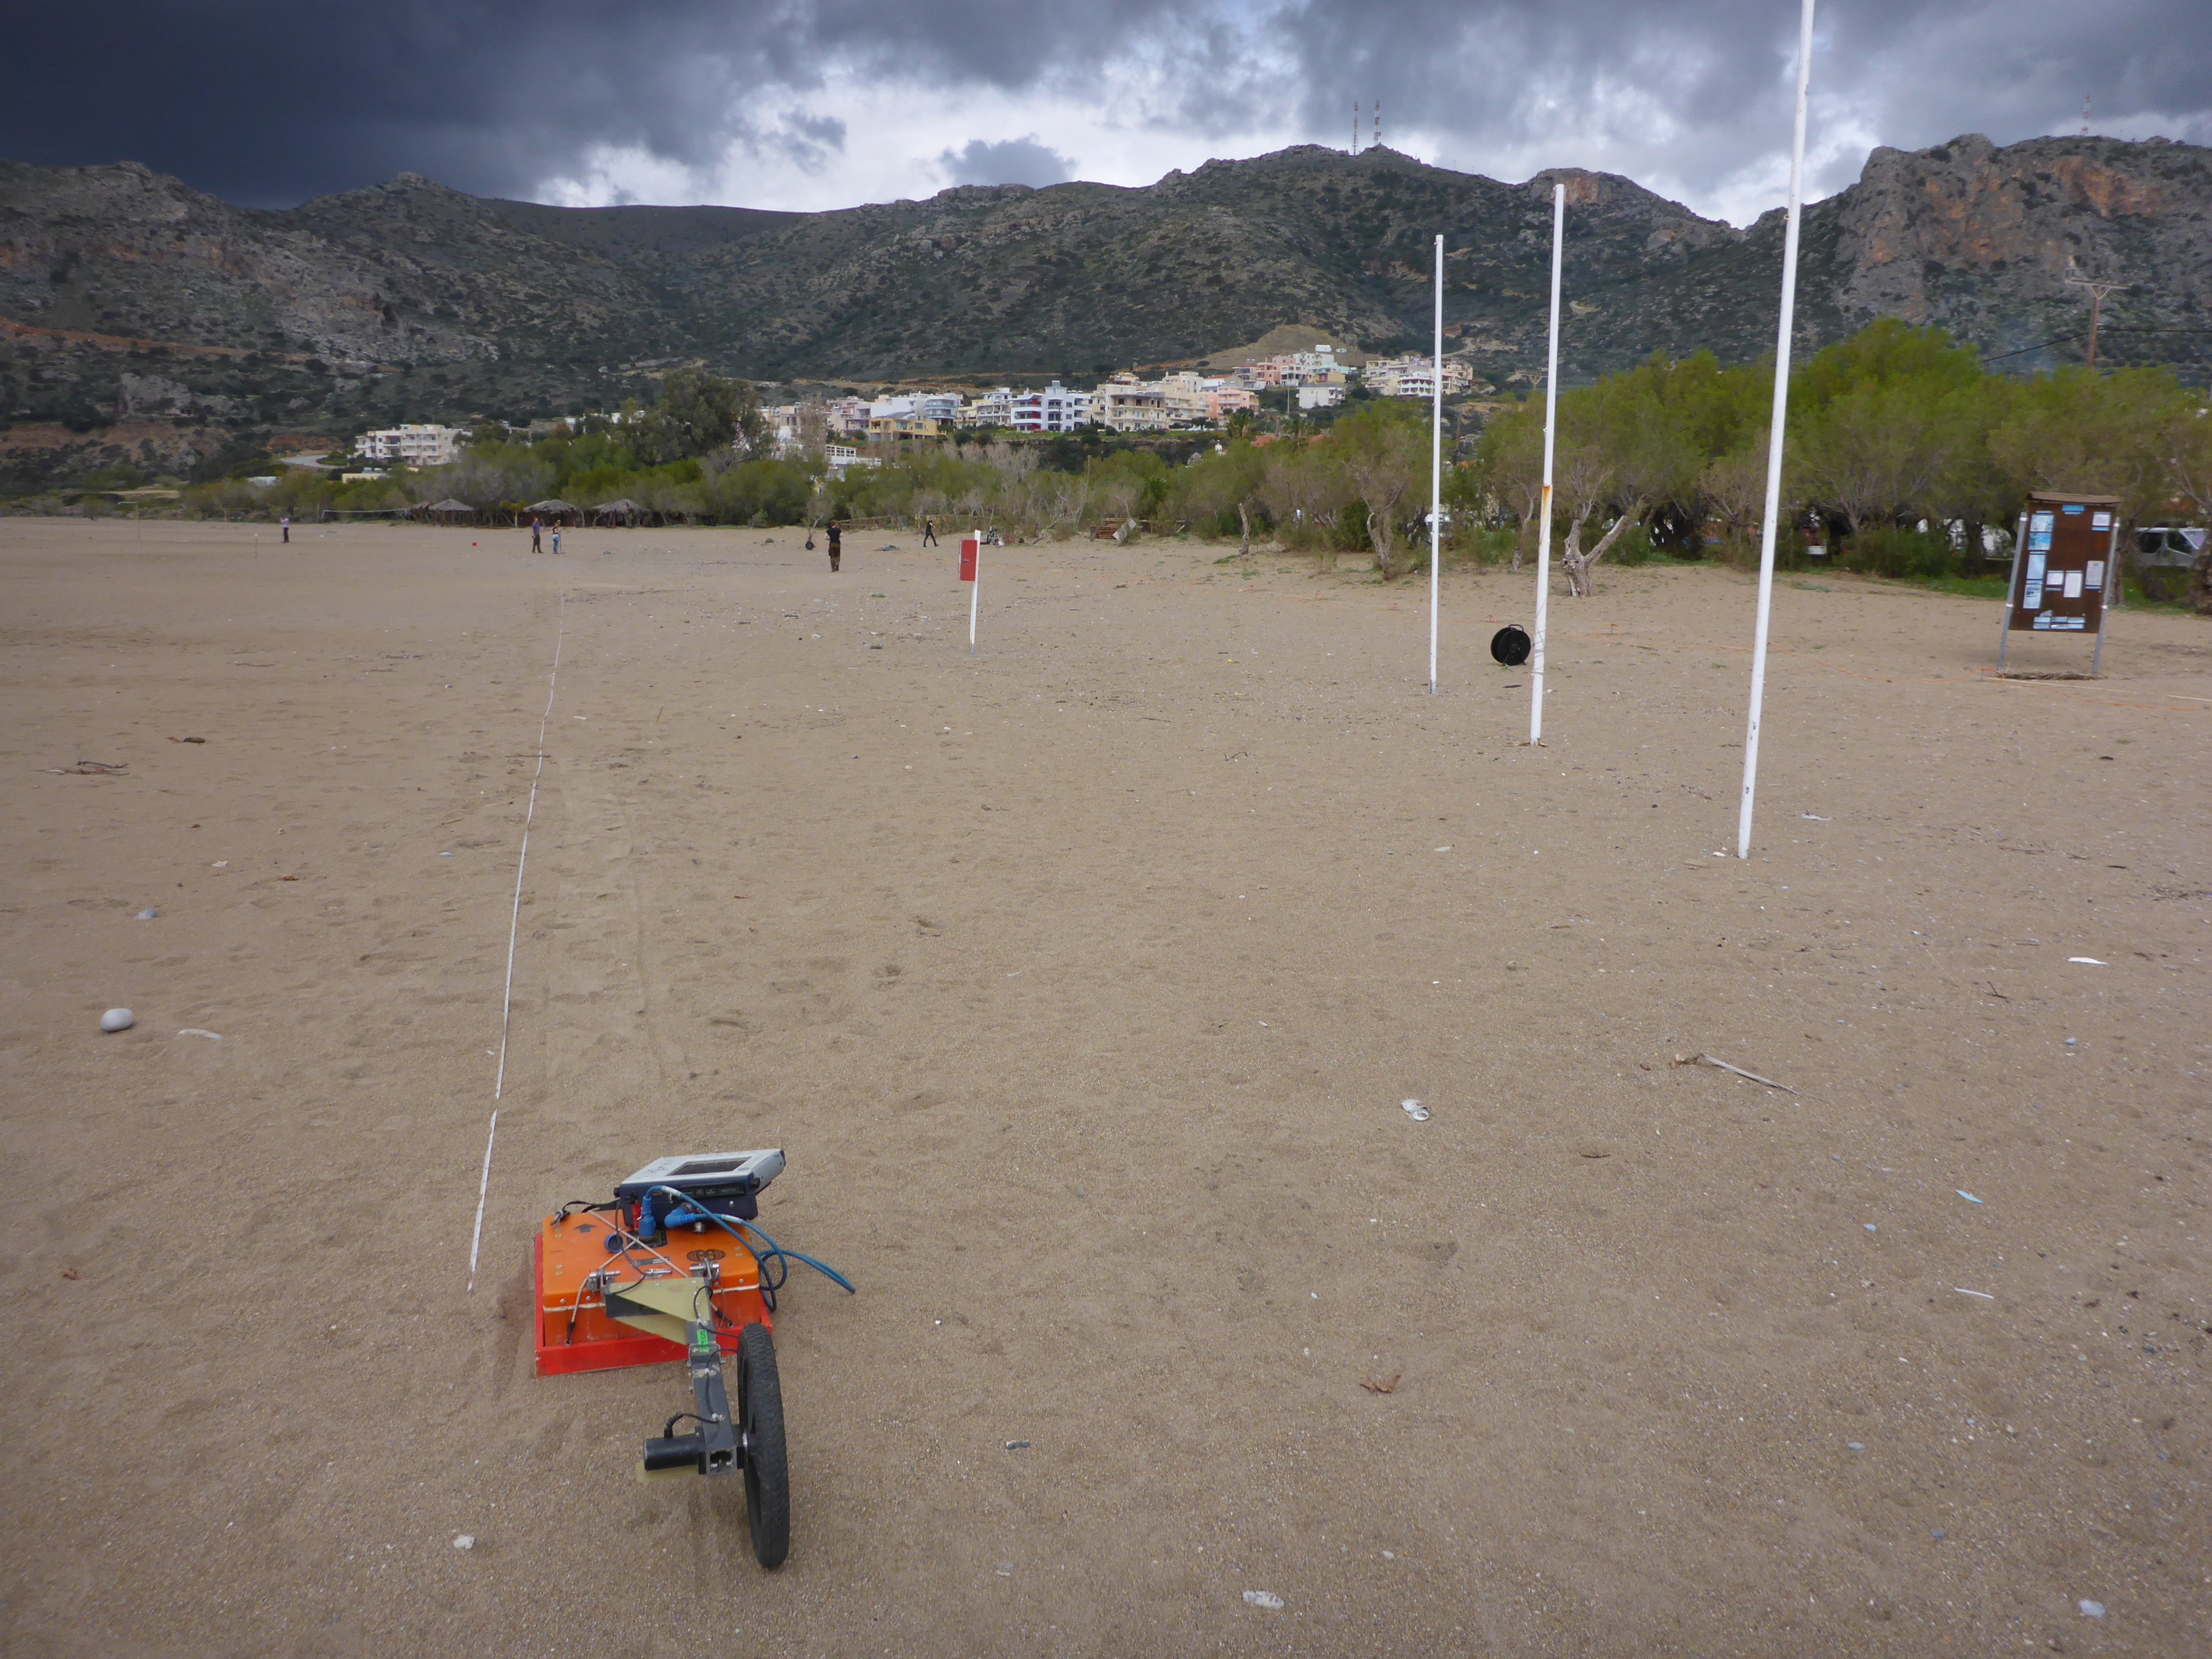
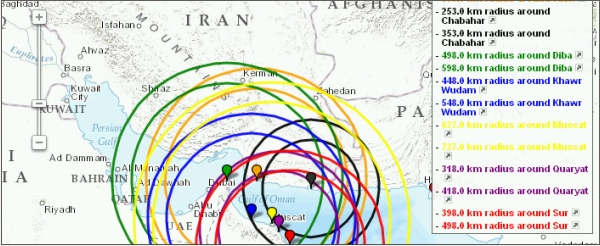
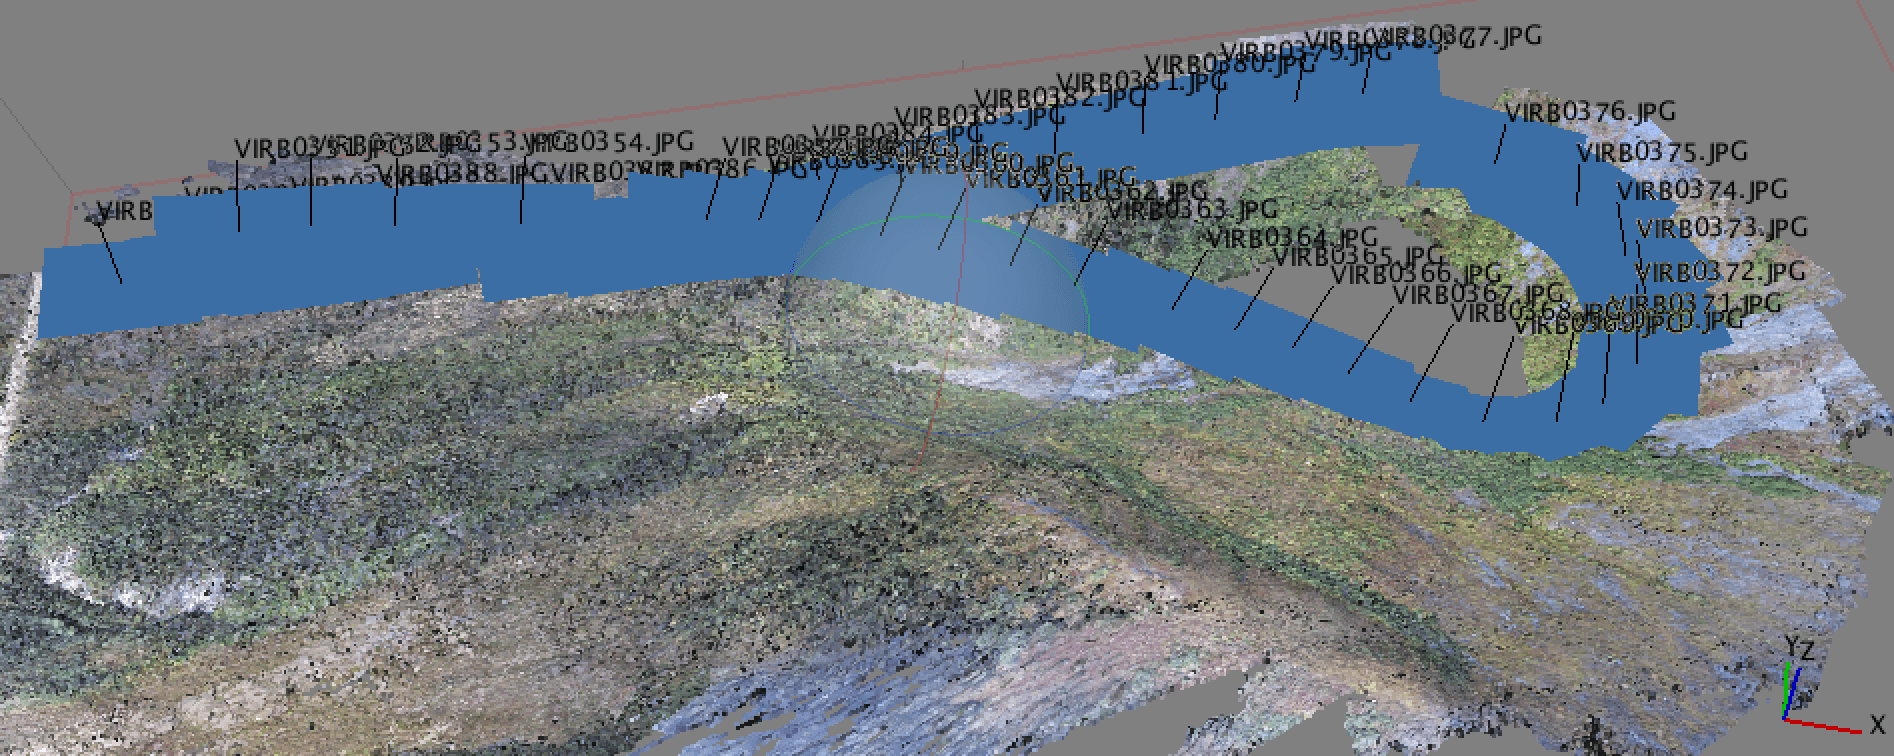
When you’re in the field you want to collect as much data as possible using all the expensive and heavy equipment you brought with. For instance, geophysical profiling (e.g. ERT, electrical resistivity tomography; GPR, ground-penetrating radar) provides high-resolution images of the shallow subsurface. Often conspicuous geometries are evidences for changes in the subsurface.

Now, following a straight line is not a big deal. In general start and end of the profile is traced via GPS. For interpreting the spatial extend of individual aspects, these are simply imported to GIS and done. Thus, tracing appearances through multiple parallel profiles is quite easy – as long as the data quality is good and external error sources are neglected. However, to compare geometries and distinct aspects of multiple non-parallel profiles an accurate visualization is indispensable. Even more when profiles do not follow a straight line but other discontinuous shapes. Imaging you are carrying out a GPR profile and for some reason you are forced to change the profile direction at one point, or your profile is following a circle a of a certain diameter around a known point. After your survey you surely want to project and interpret your data in the most efficient way. For that reason I developed SE-GPS. This is a macro-based tool to calculate every thinkable coordinate (UTM) along one profile independent from its shape:
Often we do only measure start and end coordinates of geophysical profiles because we are in a hurry and time is short in the field. Later during data procesing we need UTM coordinates of every profile point. I programmed a little tool to solve this problem.
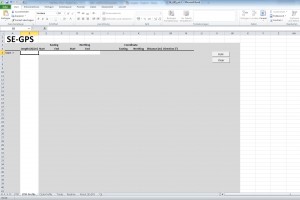
To me this tool provided helpful assistance although it is rudimentary. So I thought it might be helpful for others as well.
Thank you for reading.
