This is the first digital-geography.com tutorial for setting up an initial webmap with D3.js-JavaScript library by Mike Bostock. I see two great advantages in mapping with D3.js. The first is its picture based map output as svg (or canvas), which doesn’t need an additional map-framework á la leaflet. The second good thing is, you can combine your project easily with thousands of D3.js-libary functions and other great web- and -styling techniques. In order to show “classic” webmaps with tiled baselayers, D3.js isn’t your choice – hopefully the current vector-tiles developments will make this also possible for D3.js-driven maps.
Nowadays webmaps are often based on a mixture of web-technology and vector data. Only satellite or aerial images are – of course – provided as raster data. Dealing with vector data in D3.js can be a bit tricky, but if we understand some basic JavaScript-implementations and concepts of data formats like GeoJson or TopoJson it’s learnable. If you haven’t any idea of JavaScript, I recommend you to learn the basics on codeacademy.org.
tutorial goals:
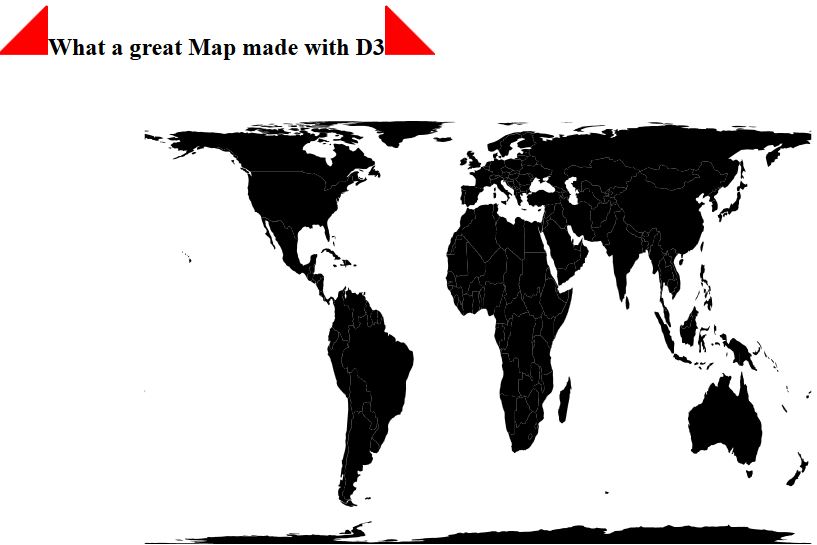
- set up a simple webmap which contains worldwide continent shapes
- set the right projection
- styling all the base-data
used tools:
- sublime text 3 (my favorite code editor although it’s not open source :p – look at Riccardos article to get more informations about that)
- this tutorial is based on the codebase of d3noobs.com (see the full article) and a dataset from the “NaturalEarth project“, processed to TopoJson by Mike Bostock
steps:
- What the hell is D3.js?
- build a simple html-structure with embedded D3.js and TopoJson wordlshape
- implement continent shape data
- initial map-styling
- what’s next?
0. What the hell is D3.js?
It’s a JavaScript library for visualizing data in web-documents. In connection with HTML, SVG and CSS, D3.js allows you to create modern visualizations for any purposes (much more than only maps). Look here for more examples.
1. build a simple html-structure with embedded D3.js
Okay, let’s get started with D3.js. First we need an index.html. Create a new folder named “first_D3_webmap”. Here insert a new file called “index.html”. Now we embed the hosted D3.js-script and check in an example dataset out of the “NaturalEarth project” in the TopoJson-format. Afterwards we start to set up our map script (please read the comments between the lines):
Create the index.html
The tutorial steps 2 (data) and 3 (styling) are now included in the code:
<!DOCTYPE html>
<meta charset="utf-8">
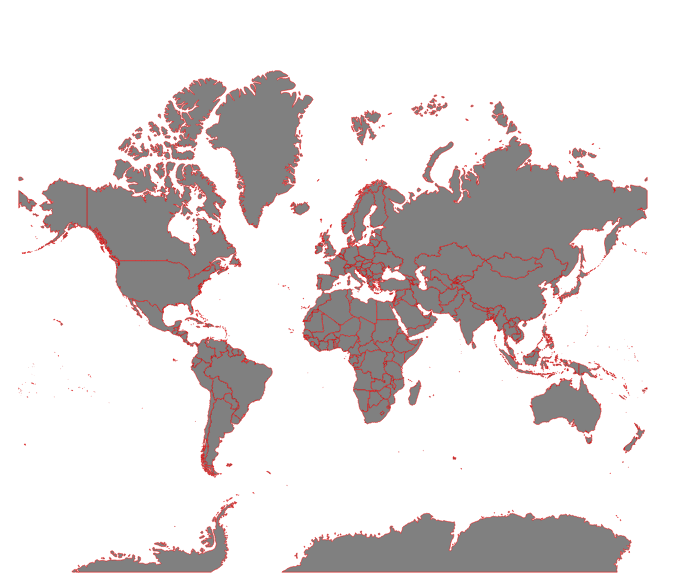
<!-- Set a style for our worldshape-data -->
<style>
path {
stroke: red;
stroke-width: 0.5px;
fill: grey;
}
</style>
<body>
<!-- implementation of the hosted D3- and TopoJson js-libraries -->
<script src="http://d3js.org/d3.v3.min.js"></script>
<script src="http://d3js.org/topojson.v0.min.js"></script>
<!-- map creation -->
<script>
// canvas resolution
var width = 1000,
height = 600;
// projection-settings for mercator
var projection = d3.geo.mercator()
// where to center the map in degrees
.center([0, 50 ])
// zoomlevel
.scale(100)
// map-rotation
.rotate([0,0]);
// defines "svg" as data type and "make canvas" command
var svg = d3.select("body").append("svg")
.attr("width", width)
.attr("height", height);
// defines "path" as return of geographic features
var path = d3.geo.path()
.projection(projection);
// group the svg layers
var g = svg.append("g");
// load data and display the map on the canvas with country geometries
d3.json("world-110m.json", function(error, topology) {
g.selectAll("path")
.data(topojson.object(topology, topology.objects.countries)
.geometries)
.enter()
.append("path")
.attr("d", path)
});
// zoom and pan functionality
/*var zoom = d3.behavior.zoom()
.on("zoom",function() {
g.attr("transform","translate("+
d3.event.translate.join(",")+")scale("+d3.event.scale+")");
g.selectAll("path")
.attr("d", path.projection(projection));
});
svg.call(zoom)*/
</script>
</body>
</html>
Further informations about the D3 Geo Projections API you can find here.
To test your code, you have to upload it to a webserver or to set up an local phyton http (very easy).
If you’re interesed in this tutorial project: get the data!
4.what’s next?
The upcoming D3 mapping tutorial will show you, how to deal with interaction on this testmap.

Hi Jakob,
Sounds interesting. Seem’s step 2 and 3 are missing.
Hi @jrmealary:disqus, step 2 and three are included in 1.
THX!