D3: a simple world map
As far as I understand, D3 is a JS library for visualization. It is designed for a very disperse user group but we will concentrate on webmap creation. But one thing still bothers me: D3 is designed especially for vector data. There are possibilities to embed tiled basemaps but this is another framework … Looking at leaflet we will start with a comparable setup: a JS library and a body. But we don’t have a div-element for the map. So as for nearly every webpage we have a start of the html and a body section. Let’S put simple text in there with a heading (” < h1>”)<! DOCTYPE html> <charset meta = "UTF-8"> <body> <h1>What a great Map made with D3</h1> </body> </html>I understand this is not fancy at all so let’s add the D3 magic:
<charset meta = "UTF-8">
<body>
<h2>What a great Map made with D3</h2>
<script  type = "text/javascript"   src = "http://d3js.org/d3.v3.min.js" > </script>
<script  src = "http://d3js.org/topojson.v0.min.js" > </script>
<script>
var projection = d3.geo.mercator()
	.center([0, 50 ])
	.scale(100)
	.rotate([0,0]);
</script>
</body>
</html>
As you can see it’s more than just the JS library for D3 but also the “plugin” to support topoJSON in D3. TopoJSON is a comparable with geoJSON but offers you to use geoJSON in a condensed way. We define our first d3 variable: the projection which uses our well-known mercator. But I would like to enter the world of projections and due to the recent hype about projections let us use the famous Gall-Peters projection by adding the projection plugin:
<charset meta = "UTF-8">
<body>
<h2>What a great Map made with D3</h2>
<script  type = "text/javascript"   src = "http://d3js.org/d3.v3.min.js" > </script>
<script  type = "text/javascript"   src = "http://d3js.org/topojson.v1.min.js" > </script>
<script  type = "text/javascript"   src = "http://d3js.org/d3.geo.projection.v0.min.js" > </script>
<script>
var projection = d3.geo.cylindricalEqualArea()
	.scale(150)
	.parallel(45);
</script>
</body>
</html>
Now we have a political correct projection with defined standard parallels at 45° N and 45° S and we choose a scale of 150 which is also the default. But for now we don’t see any map. Of course we need the data for some countries. Therefore we will add the geometries defined by a topoJSON file (download the used one here), a svg element and a path. The SVG element will be our vector graphic which holds the map and has the dimensions of 1000×500 px.
var svg = d3.select("body").append("svg")
	.attr("width", 1000)
	.attr("height", 500);
An SVG element should hold a path. This is a nice example to illustrate:This triangle is defined by a svg element in HTML, a path and some style:
<svg width="100" height="100">
<path d=" M 10 25
	L 10 75
	L 60 75
	L 10 25"
	stroke="red" stroke-width="2" fill="none" />
</svg>
In our map the path is first the definition of the path to respect the projection:
var path = d3.geo.path()
	.projection(projection);
The second step is to create a group in the svg element which holds our geometries/countries all together:
var g = svg.append("g");
And the third step is to append this group with our arcs/geometries of the topoJSON file:
d3.json("world-110m.json", function(error, topology) {
	g.selectAll("path")
		.data(topojson.object(topology, topology.objects.countries)
		.geometries)
	.enter()
		.append("path")
		.attr("d", path)
});
Here we first select the “path”/”group g” and create a join with the data of the topoJSON file which was added by “d3.json” as a result of the successful loading (“function(error, topology) {…}”).
The .enter command will create the DOM elements in the path/group and will push the geometry/topology of the data. Here “d” stands for the description of the path aka “form”.
In the end our map looks like this: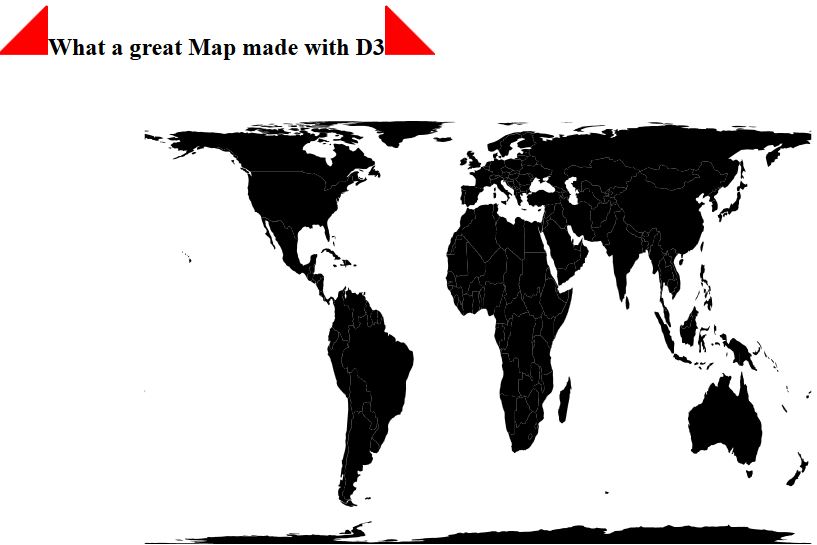
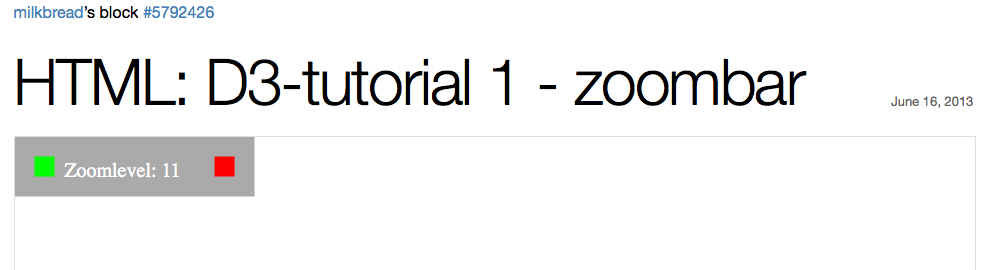

Hey good first try. I’ve been playing around with D3 recently. Here’s a graph I created.
http://bl.ocks.org/yppmark/raw/03c085ff717470a5a240/