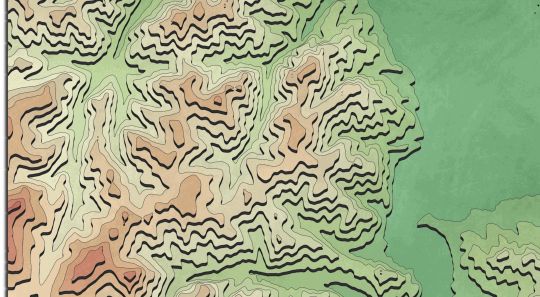
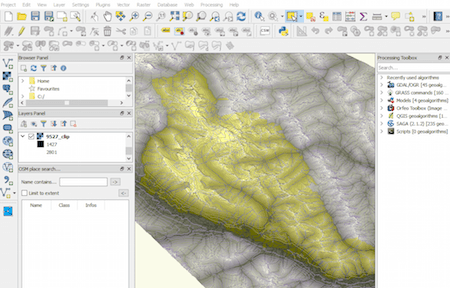
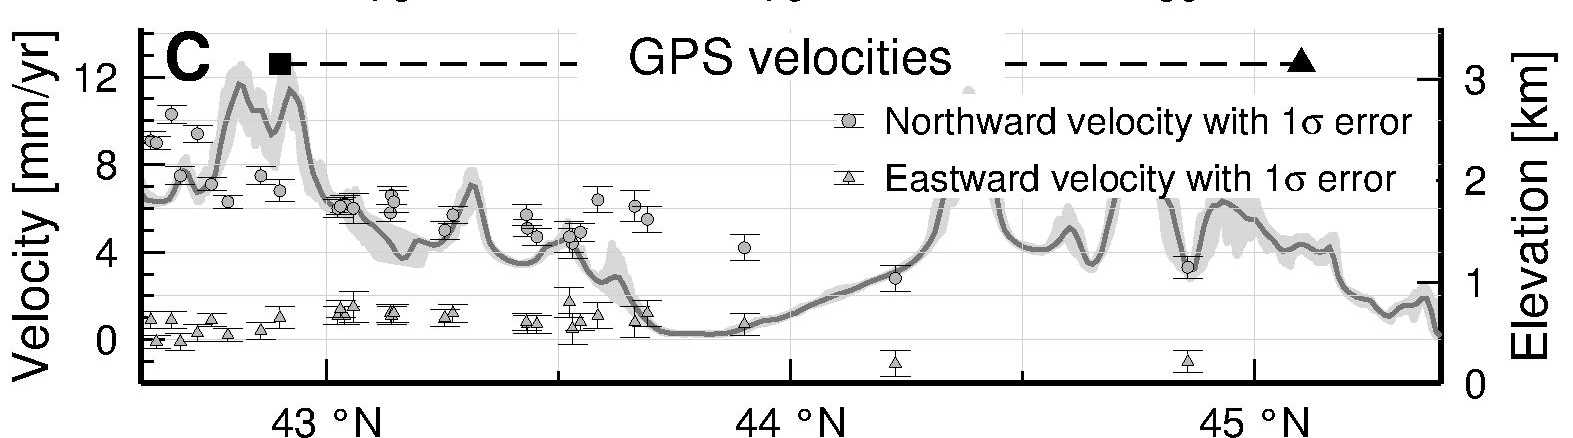
For a geomorphological study that I am working on I want to produce topographic swath profiles across a mountain range, that is, I want the average elevation along a profile plus the min and max values within a certain distance of said profile. I have used three different methods to achieve that and found some nice resources that I’d like to share with you: GMT – Generic Mapping Tools GMT is a powerful suite of command-line small programs to manipulate all kinds of geographic data (Wessel and Smith, 1998; Wessel et al., 2013). A walk through on how to produce…
The recent move from the Mongolian Post to use W3W as their new address system shed a new light on the question: Where are addresses located and how to get the correct position of an address in your GIS. In this article I would like to show different possibilities in QGIS, ArcGIS and Leaflet. This post references also mappinggis.
You probably seen this already (maybe on your very own PC as well): A folder with shape files. Well we’re living in the 21st century and I do have and use those folders still. After a talk of Sebastian Meier at Maptime Berlin I was convinced and started to work with a databases instead of folders. So let me show you how to install PostgreSQL along with PostGIS on Ubuntu and Windows, how to get data into it, import OSM data and how to connect it with QGIS/ArcGIS.
The cloud has made it easier to process large amount of data, and satellite imagery processing benefits from cloud processing too. One of the cloud services that offers access to satellite images, and abilities to process them in the cloud – no more need to download it to your computer and process it there – is Amazon Web Services. If you’ve never worked with cloud processing, getting started with AWS can be a bit daunting. This tutorial gives beginners an introduction to accessing satellite images – Landsat and Sentinel-2 – on AWS.
If you create maps you always need to ask yourself: how can I make it as easy as possible to read and still have anything I need in my map… or in short: reduction and abstraction. There are different approaches out there when it comes to web maps. Let me show you how to reduce the number of map elements with a slider in leaflet to filter your data interactively.
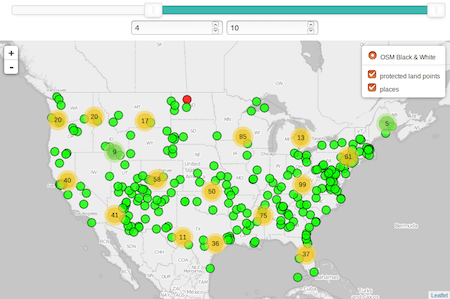
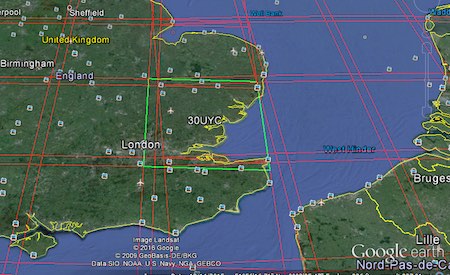
Last time we had the task to create mountain ranges polygons for the whole world. I prepared a small tutorial referred to that. Maybe you can find something interesting for you. It will show you a model on how to select defined regions, slicing raster, smoothing and also exporting desired features. Enjoy!
Sentinel is the buzzword for a series of Earth observation missions like Sentinel-1 (Land and Ocean monitoring,launched in April 2014), Sentinel-2 (land monitoring, launched in June 2015) and Sentinel-3 (marine monitoring, launched 16th of Feb 2016) and many more are planned. But how to get the data? Check it out in this post
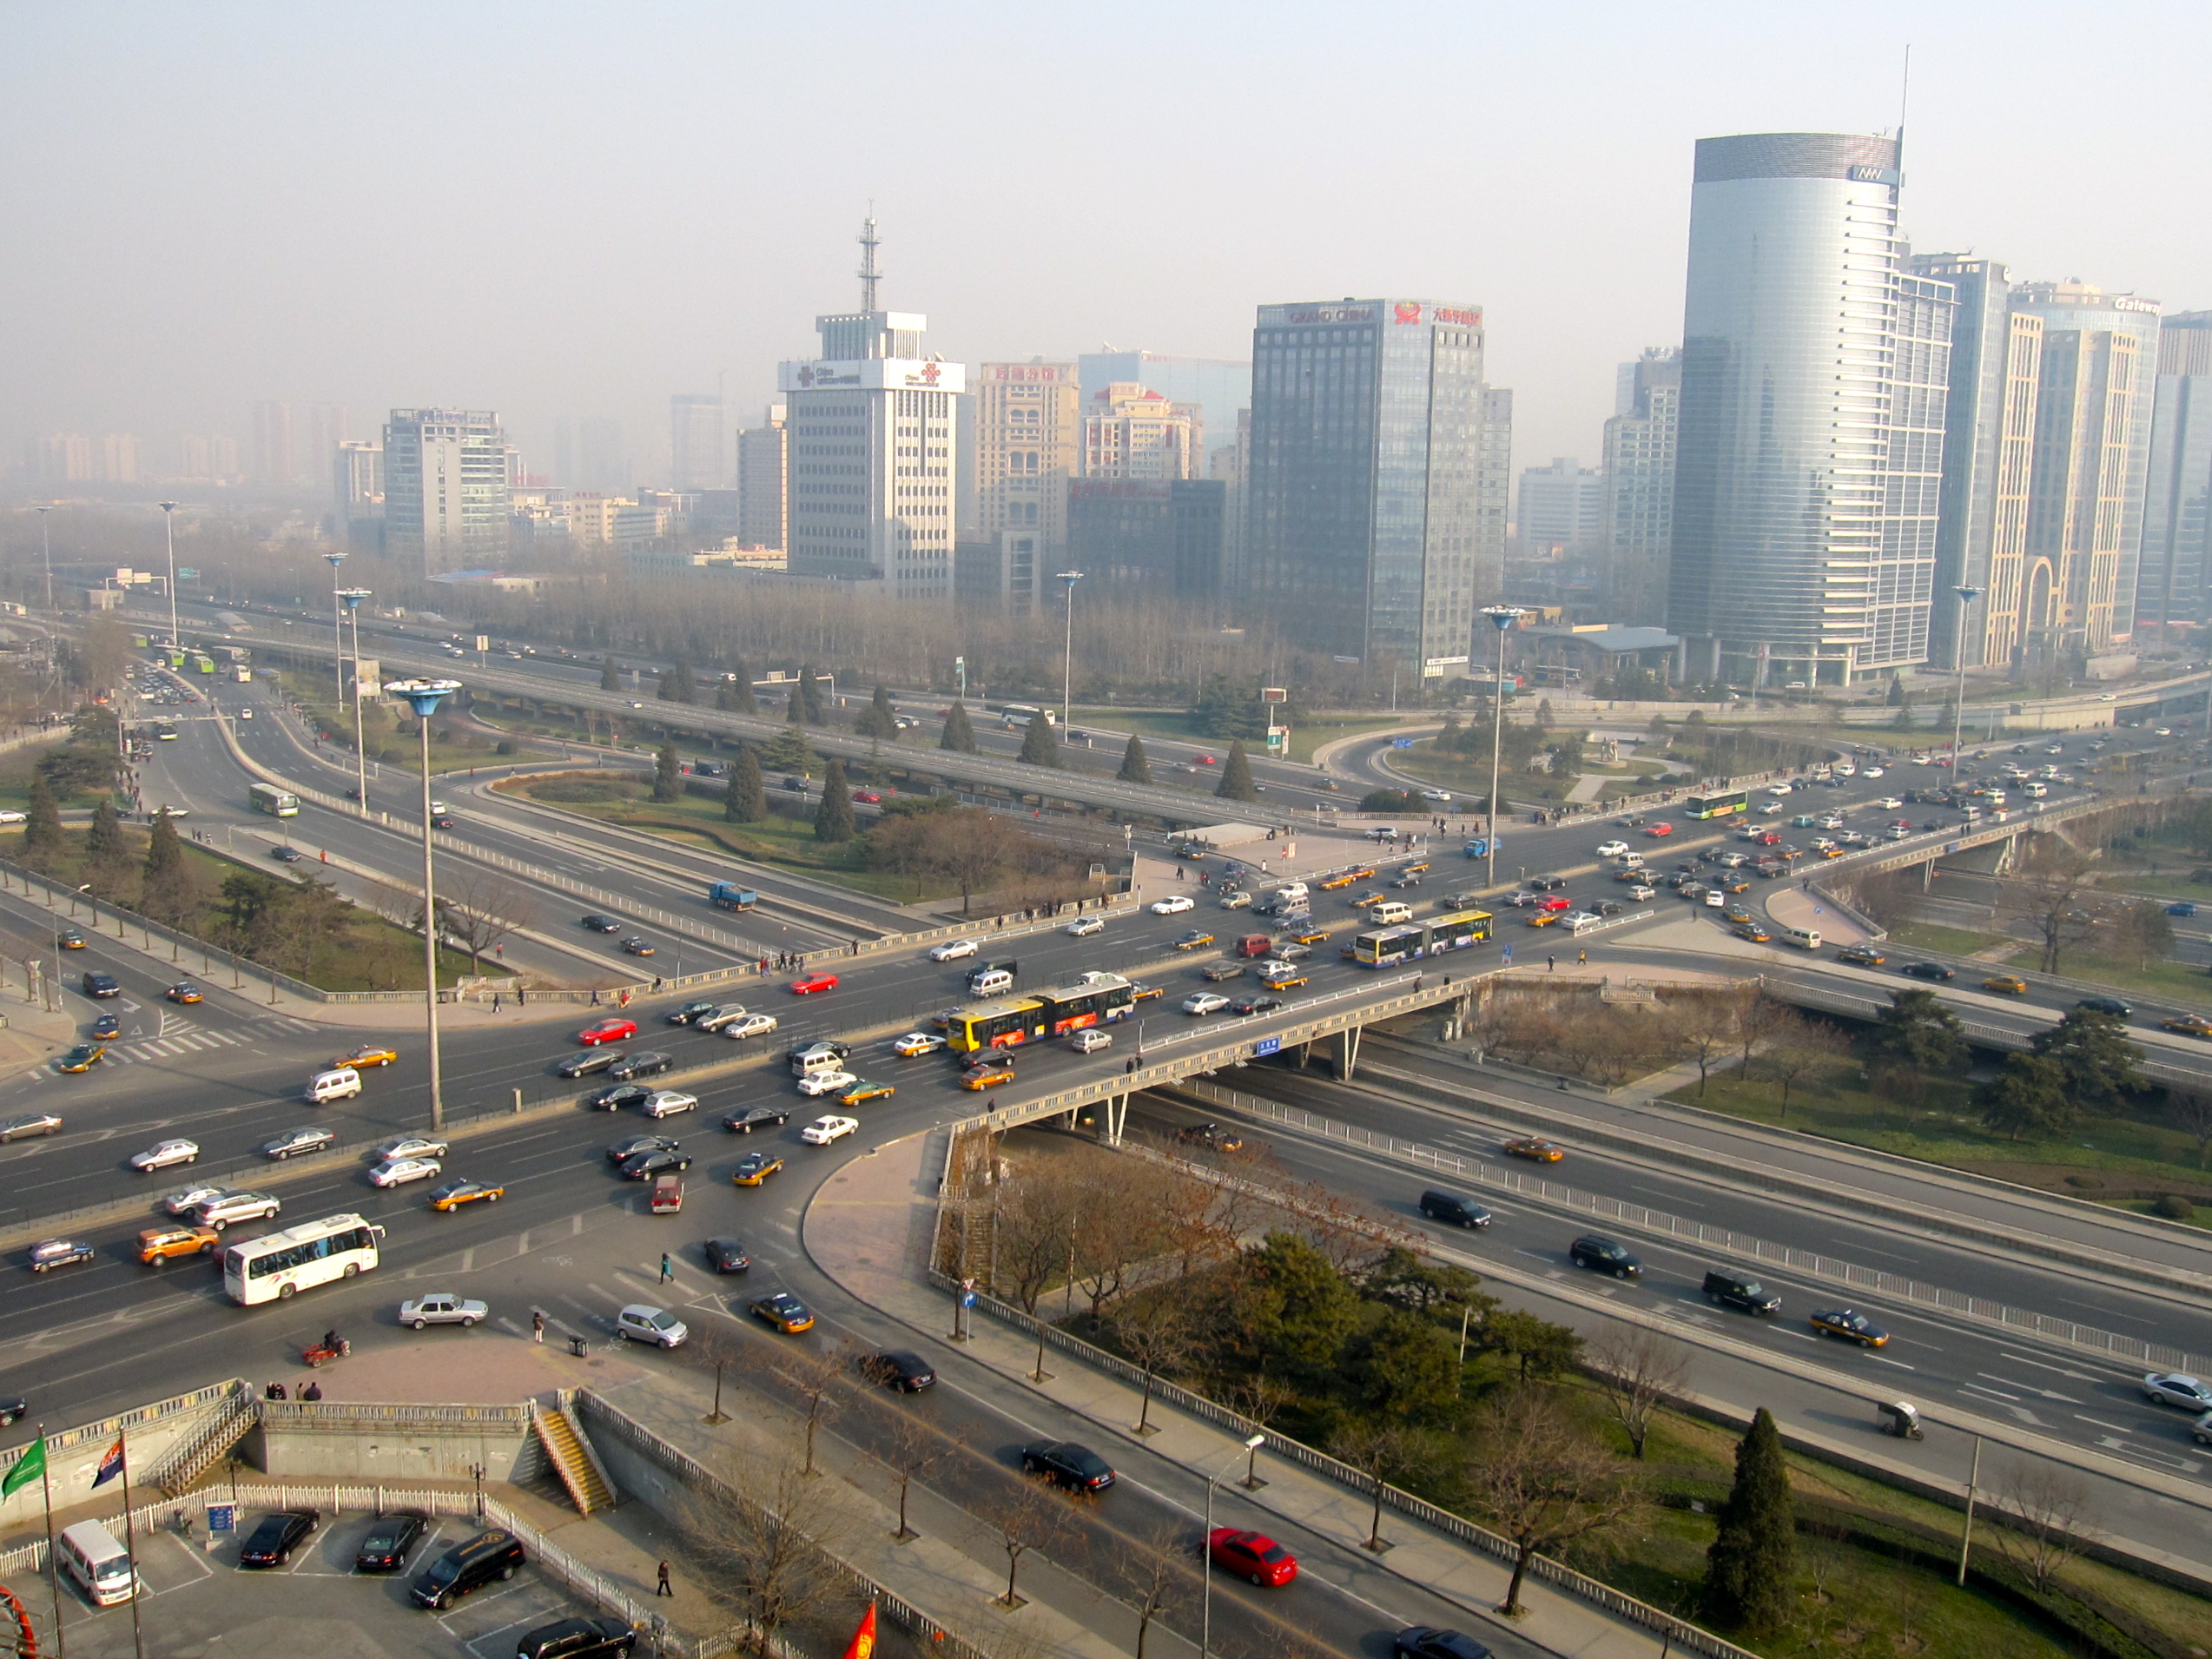
I was reading an article entitled “China, the megalopolis of 110 million inhabitants that impresses the world” on a popular online journal (see article) and after a dozen lines read: “Beijing is already surrounded by six ring roads, [… ] but the seventh will be 940 kilometers long.” How many are 940 km for example along a circle, as the Circular Highway of Milan?
Routing with Google is quite cool as the database/network is probably the best currently available. But the terms of services limit the possible usage. So what about OpenStreetMap? By figuring out how to use OSM for routing I found it much easier to get routes into QGIS with OSM compared to the Google way. Check it out….
Routing in QGIS was, as far as I know, always dependent on an available network. Either you had some database which was pgrouting enabled, or you had some network and used this via the roadgraph plugin. I would like to show you, how to do routing and path finding via googlemaps and import the path into QGIS. Big advantage: You don’t even have to think about a network…
Python is a well established script language in the GIS/geodata world. And as a Facebook friend asked how to read csvs with Python I thought about “How to convert a csv to a shp with Python?”. Keeping in mind that most GPS solutions and many internet tools offers a csv export and it’s common in any stats/spreadsheet program this can be a handy solution for your everyday life. See my solution here…
I always watched those stunning examples created with D3 by Mike Bostock, I liked Ralf’s blog posts here and I always thought to myself: get yourself together and create one for your own. But to say it straight: I haven’t figured it out… But yesterday I stumbled upon this nice, not so short post of MappingGIS.com and I would like to share my learning process here. So let’s start …
We use cookies to ensure that we give you the best experience on our website. If you continue to use this site we will assume that you are happy with it.Ok