This week ESRI will come to the real analysis of spatial data. You will get an insight into the connection between “research question” and projection, why is Mercator so nice and what are spatial properties. But let us get to the “infrastructure” of this MOOC beforehand.
The MOOC infrastructure
ATM approximately 700 out of 1200 students enrolled in the course. This could have several reasons:
- Only three mails were sent to students and two of those have instructions were to enrol (three websites/platforms are involved)
- The course content was unclear until the 1200 seats were already distributed
- You need a very good internet connection
But the instructors are very active in the discussions and try their best to get in contact with the audience on Udemy and Geonet. The linkedin group seems a little bit off-side. The discussions on Geonet and Udemy could be more interesting as most of the questions posted are about login problems and stuff related to the infrastructure/ technical questions.
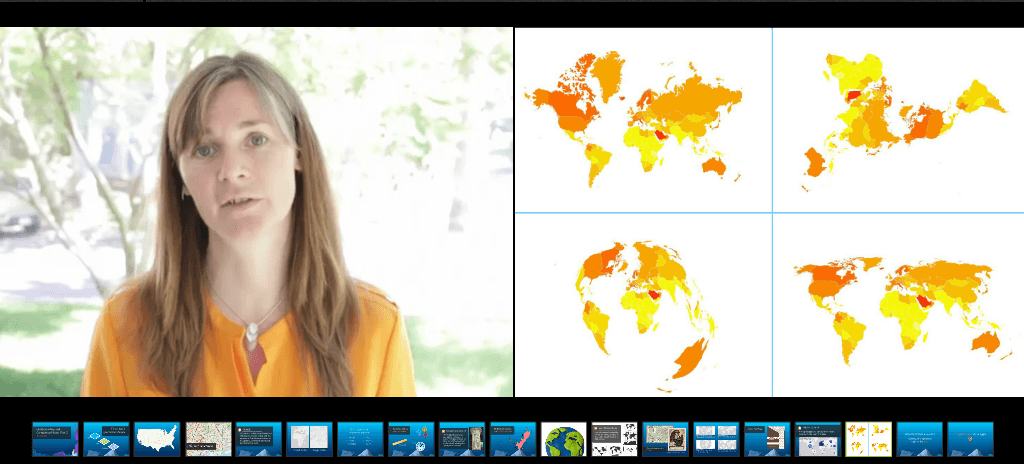
The MOOC content

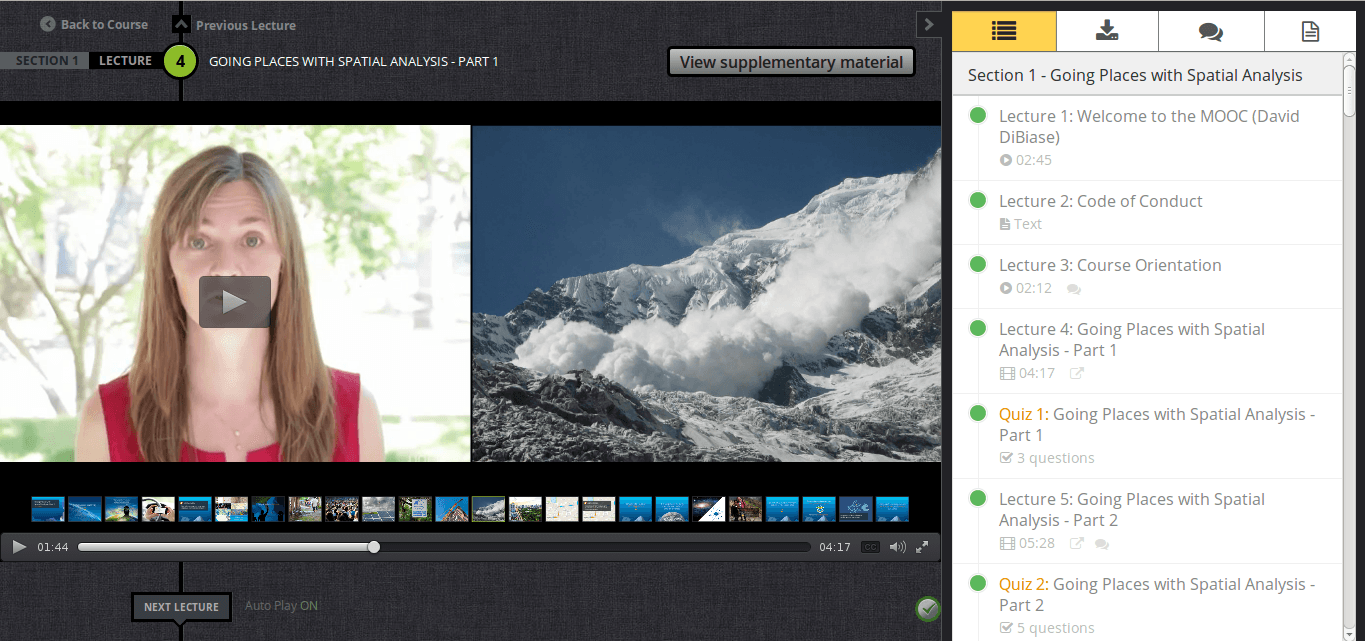
After a short and interesting insight and recap of the first week you will be confronted with a long video about why to choose spatial analysis and how to deal with data. A special topic in it is the SQL query and statistical data. Please make sure to have an idea about the idea behind standard deviation and what might be the concept of descriptive analysis to pass the first test. As with my limited English skills I needed to make the test twice. I think it would be better for the learning not to provide the correct answers so everyone will have the drive to maybe open up wikipedia or sth. else to do some research.
The second part is mainly focussed on scale, ratios, representation of features at different scales and projections. This is more or less a brief introduction and I encourage everyone to do some more research into this very important field.
Therefore the second test was a bit easier to me as the first and after this one you can get your hands dirty on some spatial analysis. In the written tutorial you will cover the points of:
- layer join
- add common USGS/Census data
- buffer zone creation
- changing symbols
- filter techniques
- alter tables (adding fields)
- using “field calculator”
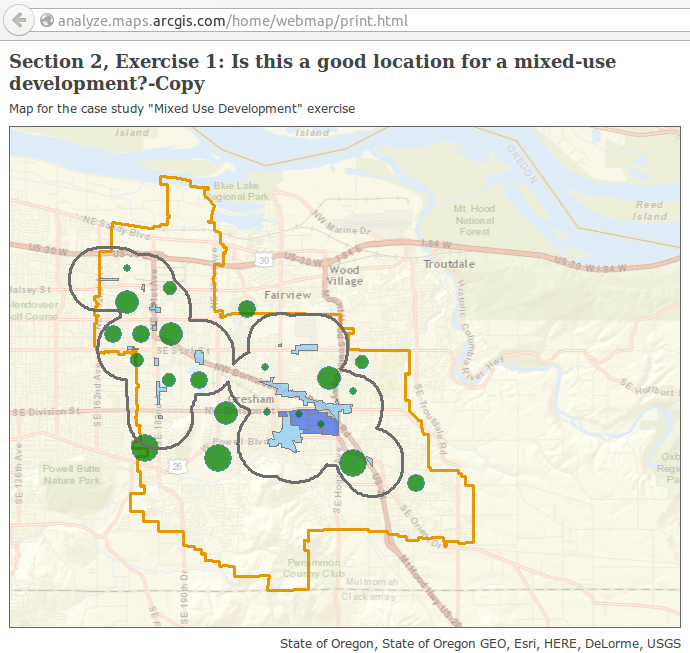
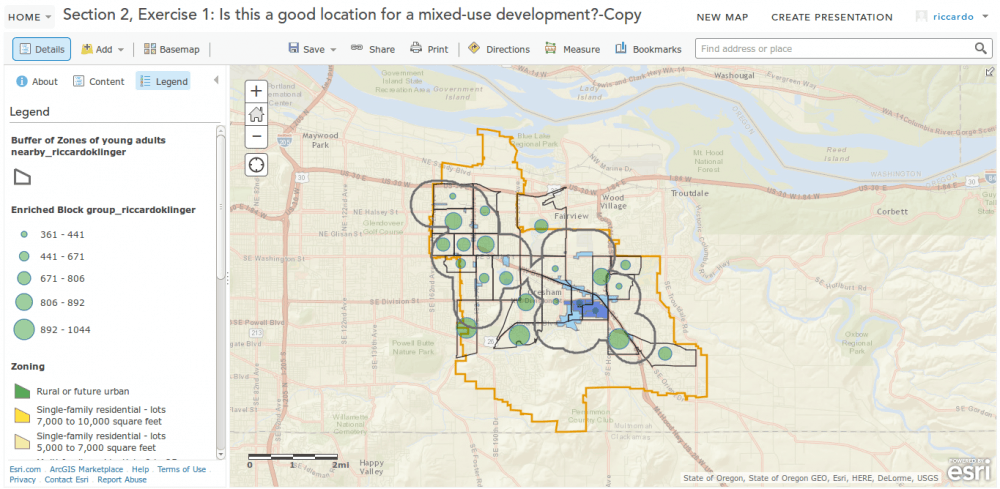
And damn they have some sweet data in this ArcGIS online… Now I know what you pay for (for US it’s much more, but still great!):
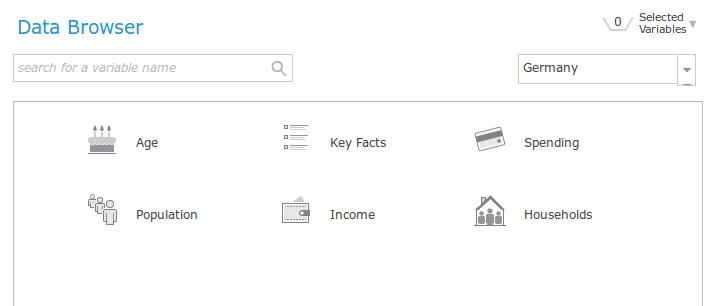
So this all ended up in a map about where to acquire some land to build some houses. Here is the map I’ve made using the print function of ArcGIS online: