The goal of this post is to explain, based on practical examples from my professional activities, how I use QGIS, its plugin photo2Shape and the processing toolbox, together with geospatial packages of R (e.g. the package ‘leaflet’) to exploit efficiently georeferenced pictures.
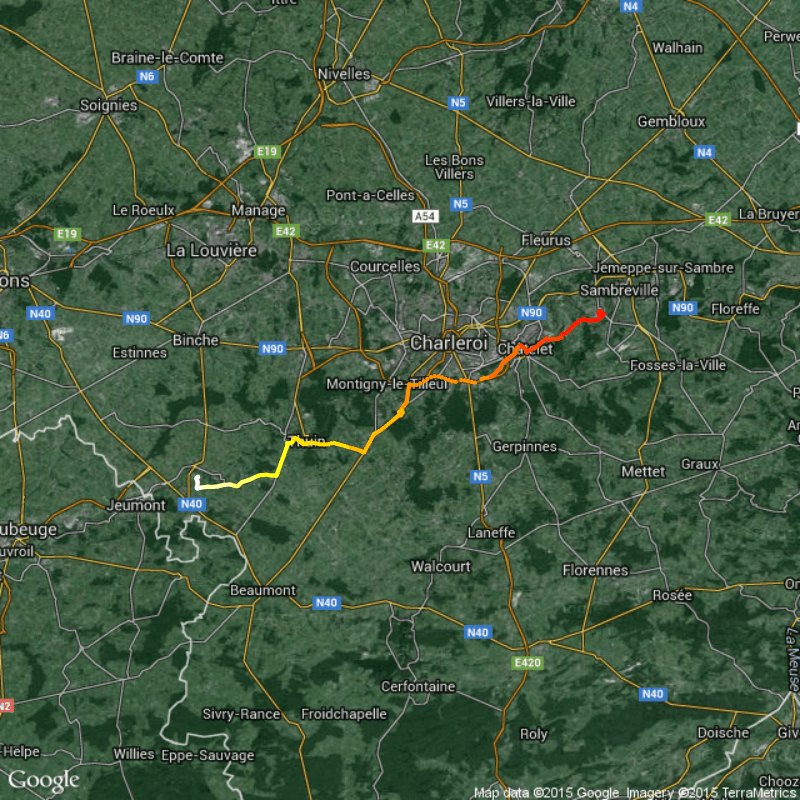
I’m working within a team for a LIFE+ biodiversity project called ‘LIFE Elia’ whose aim is to carry out actions that increase biodiversity under high tension lines. We work along 160 km of electric lines in Belgium and in 7 sites in France for 4 years now and, to date, we changed more than 285 ha by execution of apropriate management solutions of the local habitat and rising partnerships (visit our website for further information). During our field job we document our sites with a lot of georeferenced pictures taken with GPS, tablet, smart phone or regular camera. As we already collected more than 5500 georeferenced pictures, it became a necessity to develop some convenient tools to manage and use them for our daily activities as well as for a general audience presentation on our website.
This post doesn’t aim to explain the great QGIS plugins that can be used to generate web map, such as qgis2web or qgis2leaf but I just share some examples of tools I’m using and how the results look like.
Need a convenient access to our pictures collection in QGIS
So far I was using ‘actions‘ and eVis to open pictures by clicking points on a layer produced by the plugin photo2Shape. It works great but when you have thousands of items in your layer, it’s becoming quickly not so convenient to open-&-close them one by one… Then Riccardo posted 2 months ago how to show photos in QGIS with mouse hovering using the map tips tool! This tip was a great solution for me to explore pictures on-the-fly and finally open the one(s) we need, as you can see in this short screen cast:
To display each point as a marker showing the date (year with 2-digits), I choose a categorized classification of the following expression: left(“img_date”,4) . img_date and gps_date are attributes produced by photo2Shape and it might be better to use gps_date instead of img_date, it depends on how the meta-data of the pictures are collected by photo2Shape.
In the properties of the layer, the map tip displaytext is filled with this code:
<b>Commune: </b>[%"Comm"%]; <b>Année:</b> [% left("img_date" ,4)%] ; <b>Mois: </b> [% substr( "img_date",6,2)%]

[%CONCAT('<img src="'," alt="" width="300" />')%]

<b>Nom fichier:</b> [% "filename" %]

[%CASE WHEN  "Replic" > 1 THEN (' (' || "Replic" || ' photos superposées!)') ELSE '' END%]
Image source can be also defined as [%CONCAT(‘src=”/your/local/path/’,”filename”,'” width=”300″>’)%] in case of sharing a common folder on different computers (that’s our case) and the ‘width’ argument is useful to specify a unique size to all pictures.
Note that the attributes ‘Comm’ (= the name of the “commune” the point falls in) and ‘Replic’ (= how many points are stacked over each other) are automatically calculated by the following R code included as .rsx file in the processing toolbox. In the end of the screencast, one point shows 1 picture but hides 7 others, that’s why I open them later with eVis.
##[LIFE_Photos_Georef]=group
##layer=vector

setwd("/home/jf/Dropbox/CARTOGRAPHIE/02-Couches references")
library('rgeos')
# Script to reshape and fill point layer made by photo2Shape
# Add a column 'commune'
comm <- readOGR(dsn="/home/jf/Dropbox/CARTOGRAPHIE/03-Fonds de carte_Vectoriel",layer="communes_rw")
# Reproject PHOTOSGEOREF and comm
communes <- spTransform(comm,CRS("+init=epsg:31370"))
PG <- spTransform(layer,CRS("+init=epsg:31370"))
# Associate points to communes they belong to
PG$Comm <- levels(communes$NOM2)[as.numeric(as.character(apply(gContains(communes,PG,byid=T),1,function(x){communes$NOM2[x]})))]
# Count how many points are at the same coordinates (to meter precision in Lambert72 projection)
CRD <- round(PG@coords,0)
PG$Replic <- sapply(1:length(CRD[,1]),function(x){sum(CRD[x,1]==CRD[,1] & CRD[x,2]==CRD[,2])})
# Export PG to shapefile
writeOGR(PG,dsn=".","PhotoGeoRef_Complet",driver="ESRI Shapefile",overwrite_layer = T)
Produce an html with a leaflet interface
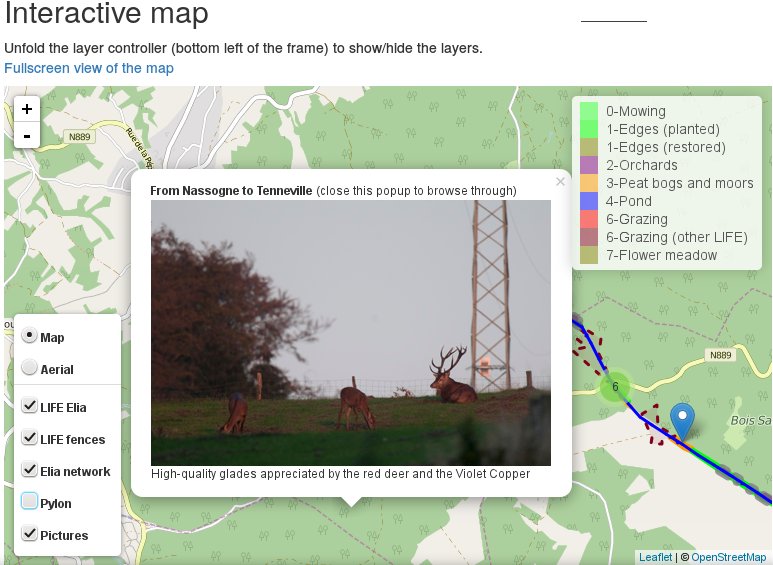
On our website, you can pay a visit to -so far- 3 of our sites (this one, this one or this one. Better use the link inside of the page to open the map fullscreen) to see what we did, under which high tension line, between which pylons, where we installed fences and look at the pictures we have selected. I’ll not present here the full code to produce the map because it’s easy to find some tutorials about leaflet for R on the web. It’s done entirely in R under RStudio, the layout of the page is a R Markdown knitted with render() function of the package {rmarkdown}.
The workflow is:
- select the pictures to include on the website (see the tip below)
- create a new layer of points with photo2Shape
- add manually a column ‘Title’ where we give a name or a short comment of the picture
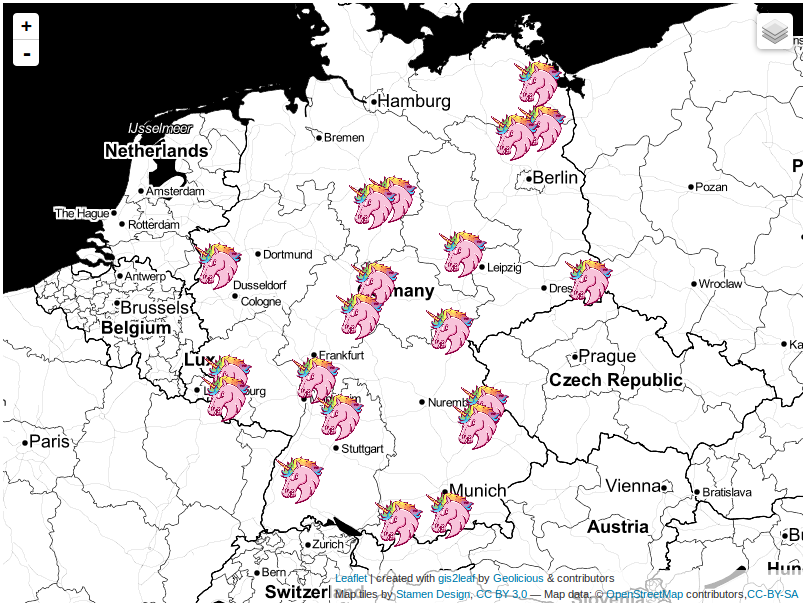
- add a welcome pop-up with a poetical sentence, just for fun!
- knit the html
- upload it and the pictures on the web
Tip: It’s stupid but how to select, out of 5500 pictures, a subset of few hundreds and then manually keep the ones I want to see on the website? For this purpose, I made a one-line .rsx script for the processing toolbox of QGIS to copy at once all selected pictures from the main layer to a temporary file:
##[LIFE_Photos_Georef]=group
##layer=vector
file.copy(as.character(layer$filepath),paste("/my/dest/folder/TMP_TriPhotoGeoRef",layer$filename,sep="/"))
The code snippets are all blank.
Dear Keith, codes are OK here with Firefox, seems ok under windows 10 explorer. Did you try any other browser? What OS do you use?
Was at work. Google Chrome in windows 7. It looks fine on my android phone just now. Not sure what the problem was.