The last post about our famous qgis2leaf plugin showed a glimpse of what it is capable of: exporting all your features from a QGIS project to a working leaflet based webmap. Sounds great, huh? Well it is!
The new version
In the first version we just explored the workflow:
- export the features to geojson with python and QGIS API
- create files with python
- GUI design
- special character handling
- and stuff …
In the newest version we offer much more possibilities for your data:
- export polylines, polygons and points
- dozens of basemaps available
- define the icon to use for points
- define the popup content for all shapes
- preservation of styles as far as possible: colors, transparency (points, lines, polygons), width (lines, points)
- definition of the extent
At the moment the plugin can handle categorized, graduated and single symbol styles.
See it here with a line example:
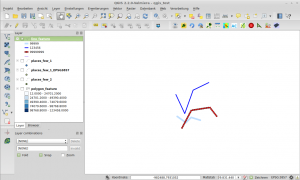
The exported map shows nearly same setup:
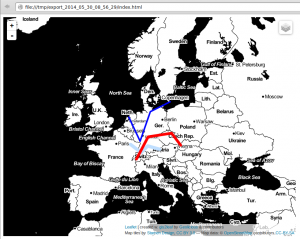
The same works for all the other feature styles.
Custom icons and popups
If you want to have custom icons and popups you need to tweak your layer a little. For custom icons you need to add an attribute called icon_exp. The provided link or absolute path to folder will define the image. PNG or SVG files will work fine:
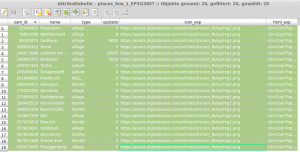
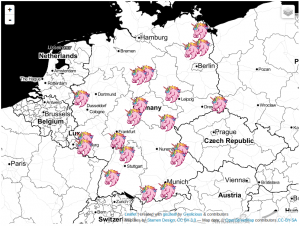
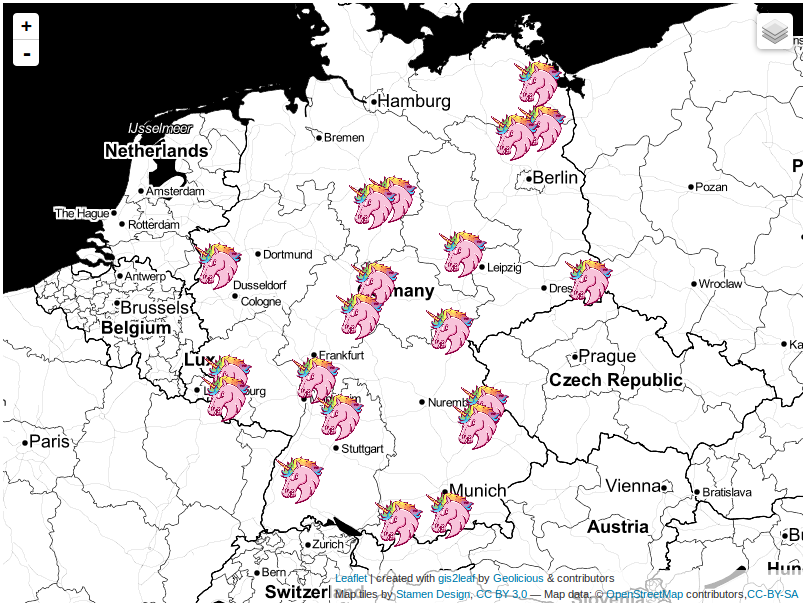
And BAAM that is a fancy map:
Defining the popup content works similar. You just need to add the attribute html_exp and the value of this field will define the popup content:
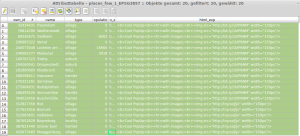
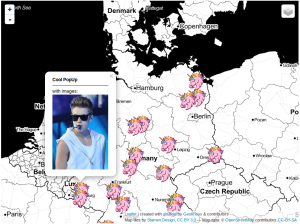
Instead of an ugly table holding all your data the popup can show some girly stuff or other information:
You can download the newest stable version 0.9 via the manage plugin dialog in QGIS. Ujaval Gandhi provides another great tutorial on this plugin on his site. If you see any issues please report them here or contact us.

what a nice post. this is a test comment
[…] know this has gotten a lot of press (link to a great write up here or here) so I will not spend that much time on it, but seriously I cannot write about QGIS […]
[…] wenn das Plugin von Riccardo schon viel Aufmerksamkeit bekommen hat (hier oder hier), muss es in dieser Aufstellung […]
[…] know this has gotten a lot of press (link to a great write up here or here) so I will not spend that much time on it, but seriously I cannot write about QGIS […]
Amazing!! Thanks so much. I have been trying hard to add images. Tried asking for help on Ujaval Gandhi’s site but couldnt get a response. Anyway I am very happy I have finally succeeded. That one screenshot of the attribute table that you have put up did the trick for me. Hearty thanks again. 🙂