When it comes to webmapping there are thousands of possible markers you can choose from but when it comes to markers depending on the data, which is inside the shapefile, possibilities are more limited. In leaflet you can define different icons according to the attributes of your data by defining the icon url in an attribute. Let me show you, how to use the data in each feature to create a custom icon like a piechart marker using R.
For this you will need R installed. Especially if you’re new to R I highly recommend RStudio. It has a great GUI and it’s platform independent.
Getting data into R
To enable R reading shapefiles we will need to load additional libraries into R. Therefore we are using the gdal bindings to R:
setwd("~/r_pie")# set the working directory with your files inside:
install.packages("sp") #will be needed to load rgdal
library("sp")
install.packages("rgdal") #here's rgdal
library("rgdal") #enable it for your workflow
Now let’s have look at the Shapefile itself which will be exported:
ogrListLayers("places.shp")
shape<-readOGR("places.shp", layer="places") #will load the shapefile to your dataset.
data<-shape@data
view(data)
Create piecharts and store everything
As we are now having the data stored in an extra variable we can do “crazy stuff” and having a simple loop over the data and create a piechart for every entry according to the variables in columns 9 to 13:
for (i in 1:dim(data)[1]){ #will use every line of the attribute table
  svg(paste(,"/plots",i,".svg", sep = ""), bg="transparent") #creates an svg file were we will "print into"
  pie(t(data[i,9:13]), init.angle = 90, col=c("red","blue","yellow", "green", "grey"), labels=NA) #this will create the pie chart itself with five collors as we have five columns
  dev.off()
}
What we need to do now? Change the attribute table an add a new column with the pathes we just used to store the svgs.
for (i in 1:dim(data)[1]){
  shape$icon_exp[i] <- paste(getwd(),"/plots",i,".svg", sep = "") #will populate a new attribute with the paths
}
writeOGR(shape, "places", driver="ESRI Shapefile", layer="places")
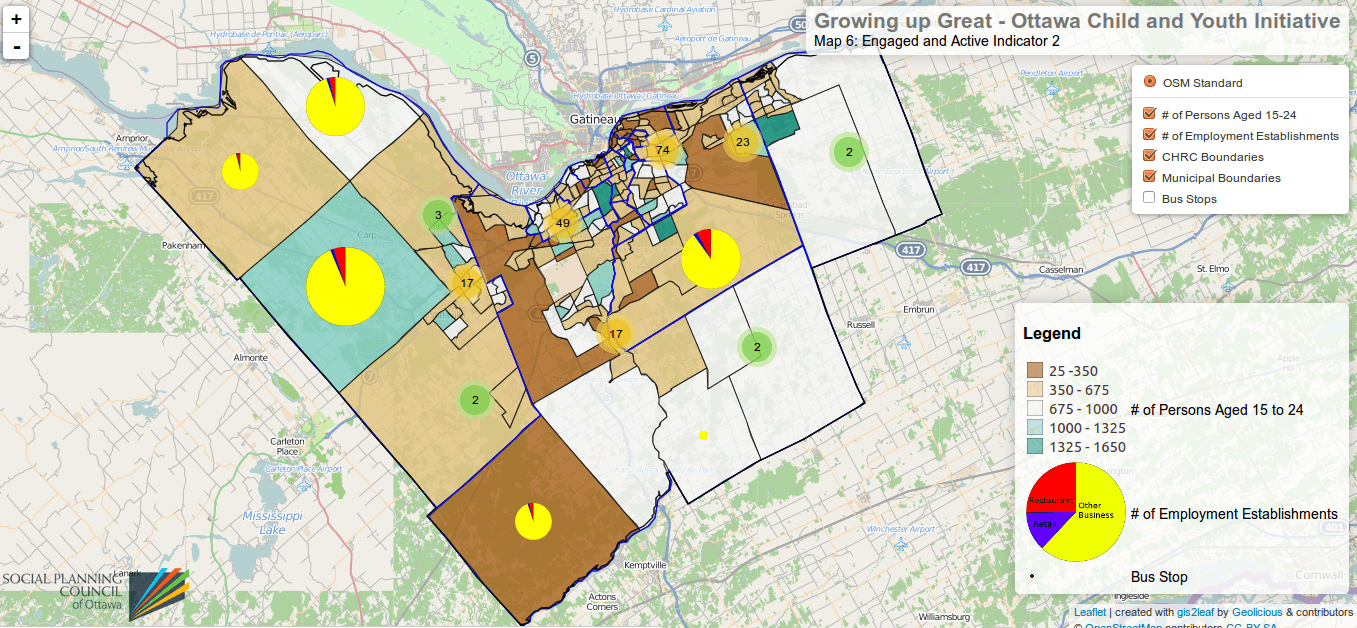
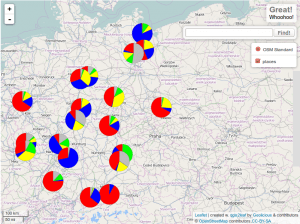
Now load it into QGIS and export it via QGIS2leaf… The icons are a bit small, but you can easily change this by looking at the code in line 47:
iconSize:     [24, 24],
iconAnchor:   [12, 12]
popupAnchor:  [0, -14]
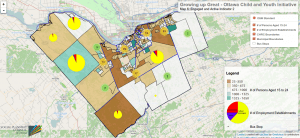
Increase values as you like and it could look like this:

Is there an example where we can see this working?
I’ll add a file shortly. Sorry
No thank you, this is great share. I am really interested learning more about this now.
so what do you mean by “see this working”?
I am also very interested in the dataset! Thank you for your work!
I’ve updated the article now. Find the shape file and the r script at the end of the article
how did you get the legend to work? I use the QGIS2Leaf plugin but the legend does not show up. Can you share your code?
Hi Teddy, Just make sure to have both columns filled with text: legend_exp and legend_ico with the text to show (legend_exp) and a path to an image to show besides: (legend_ico). You can find a predefined example data set here: https://digital-geography.com%20.www378.your-server.de/diggeo/wp-content/uploads/2014/12/legend_tester.zip
Thanks Riccardo. This is very helpful