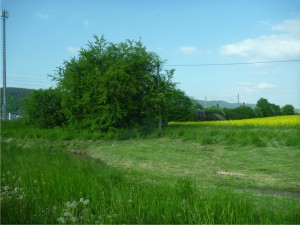
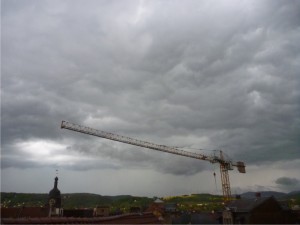
On Saturday, some villages near my hometown suffered heavy rains. Up to 100 l/m² arrived during the afternoon and evening in Kirchhasel and other places in central Thuringia. Small streams became rivers and flash flooding occurred, damaging houses, roads, and cars. The local newspaper has an impressive pic dump. Locals say this have been the worst flooding for at least 40 years, so pretty much excitement here, we are not really used to this despite the river Saale caused some heavy floodings in the past. Now it looks like thunderstorms will arrive again:
So I had a reason to think about the question: Where do I get some good weather and precipitation data from? If available, in a nice graphic way?
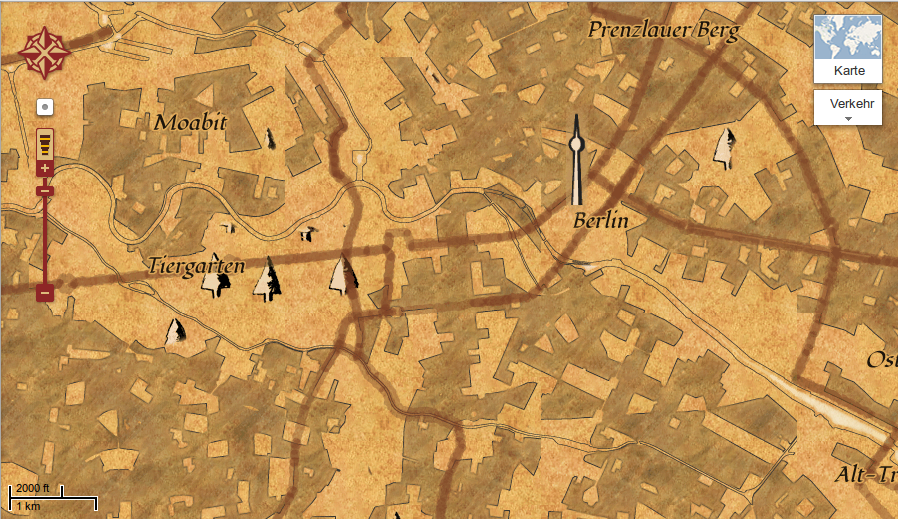
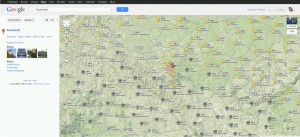
Well, of course there is Google Maps:
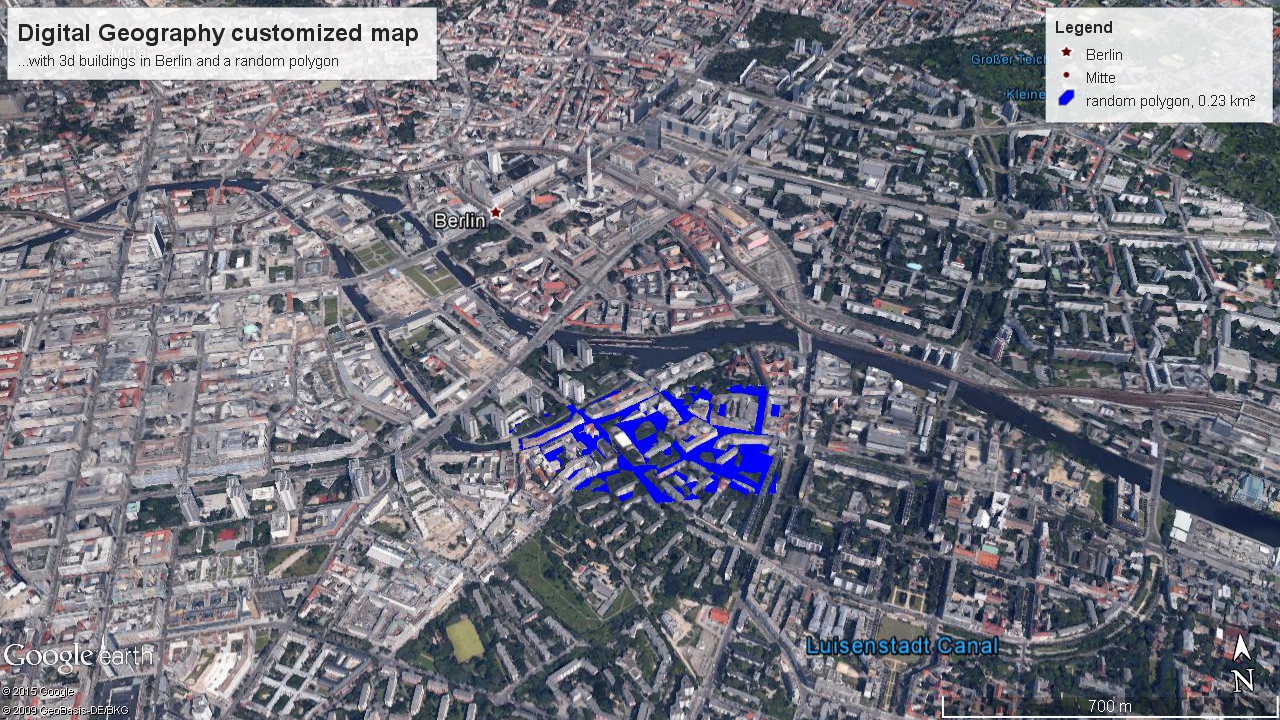
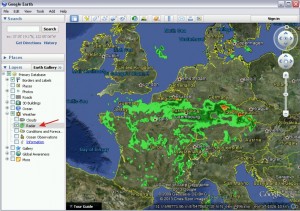
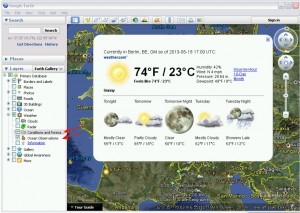
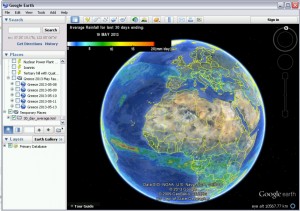
GoogleEarth is waaaay better with its great weather overlays. In the past not all of them had data for Germany, but now there is good information.
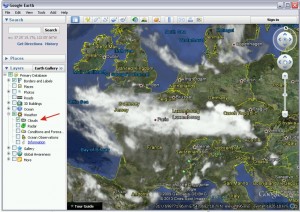
If you toggle “information” in the lower left panel, you can also start a cloud animation covering the last few hours.
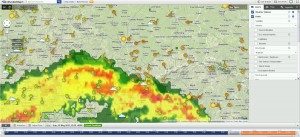
If I am interested in some good rain radar data, I usually check the WunderMap by Wunderground.com (which means Weather Underground). There you do not only find world-wide weather data like winds, temperature, precipitation and rain radar, but they also have found a nice way of visualising the data.
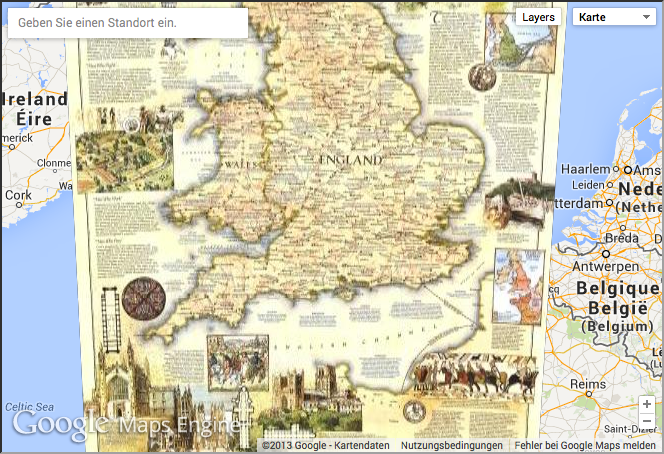
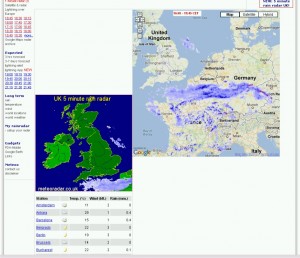
Over at Meteox there is another web mapping application with weather and radar data, they are somehow specialized on the UK, though.
If I am in Aachen, I usually have a look at weerradar.nl before I go for a BBQ…
NASA’s Tropical Rainfall Measurement Mission (TRMM) is a very useful data source if you are not interested in too high or low latitude areas (but I am mostly working in the Med area, so I am fine with this). You have access not only to recent rainfall data, but also to older datasets, average precipitation, anomalies and so on.
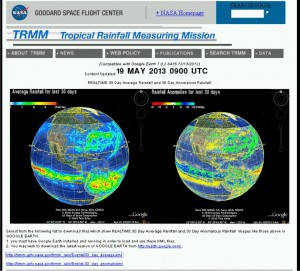
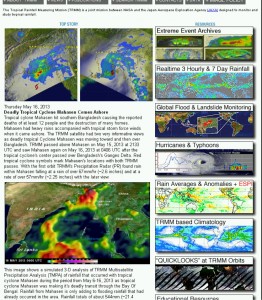
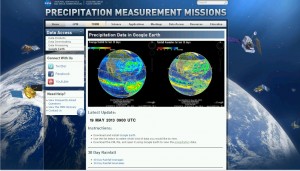
Of course they also have a great GoogleEarth overlay:
Make sure to check out the other Precipitation Measurement Missions, too!
Don’t miss this nice website for getting to know about using GoogleEarth for rainfall data mining: http://serc.carleton.edu/eyesinthesky2/week10/visualize_rain_patterns.html
By the way, all the forecasts were right, it is raining like hell here in Rudolstadt now, and there is plenty of sediment coming down the hills.
Last week when I was in Greece I experienced some very intense rain, too – this is not the stuff I expected there. Maybe I should get paid for avoiding some flood-risk areas…
[youtube http://www.youtube.com/watch?v=DJJIYTE15tI]