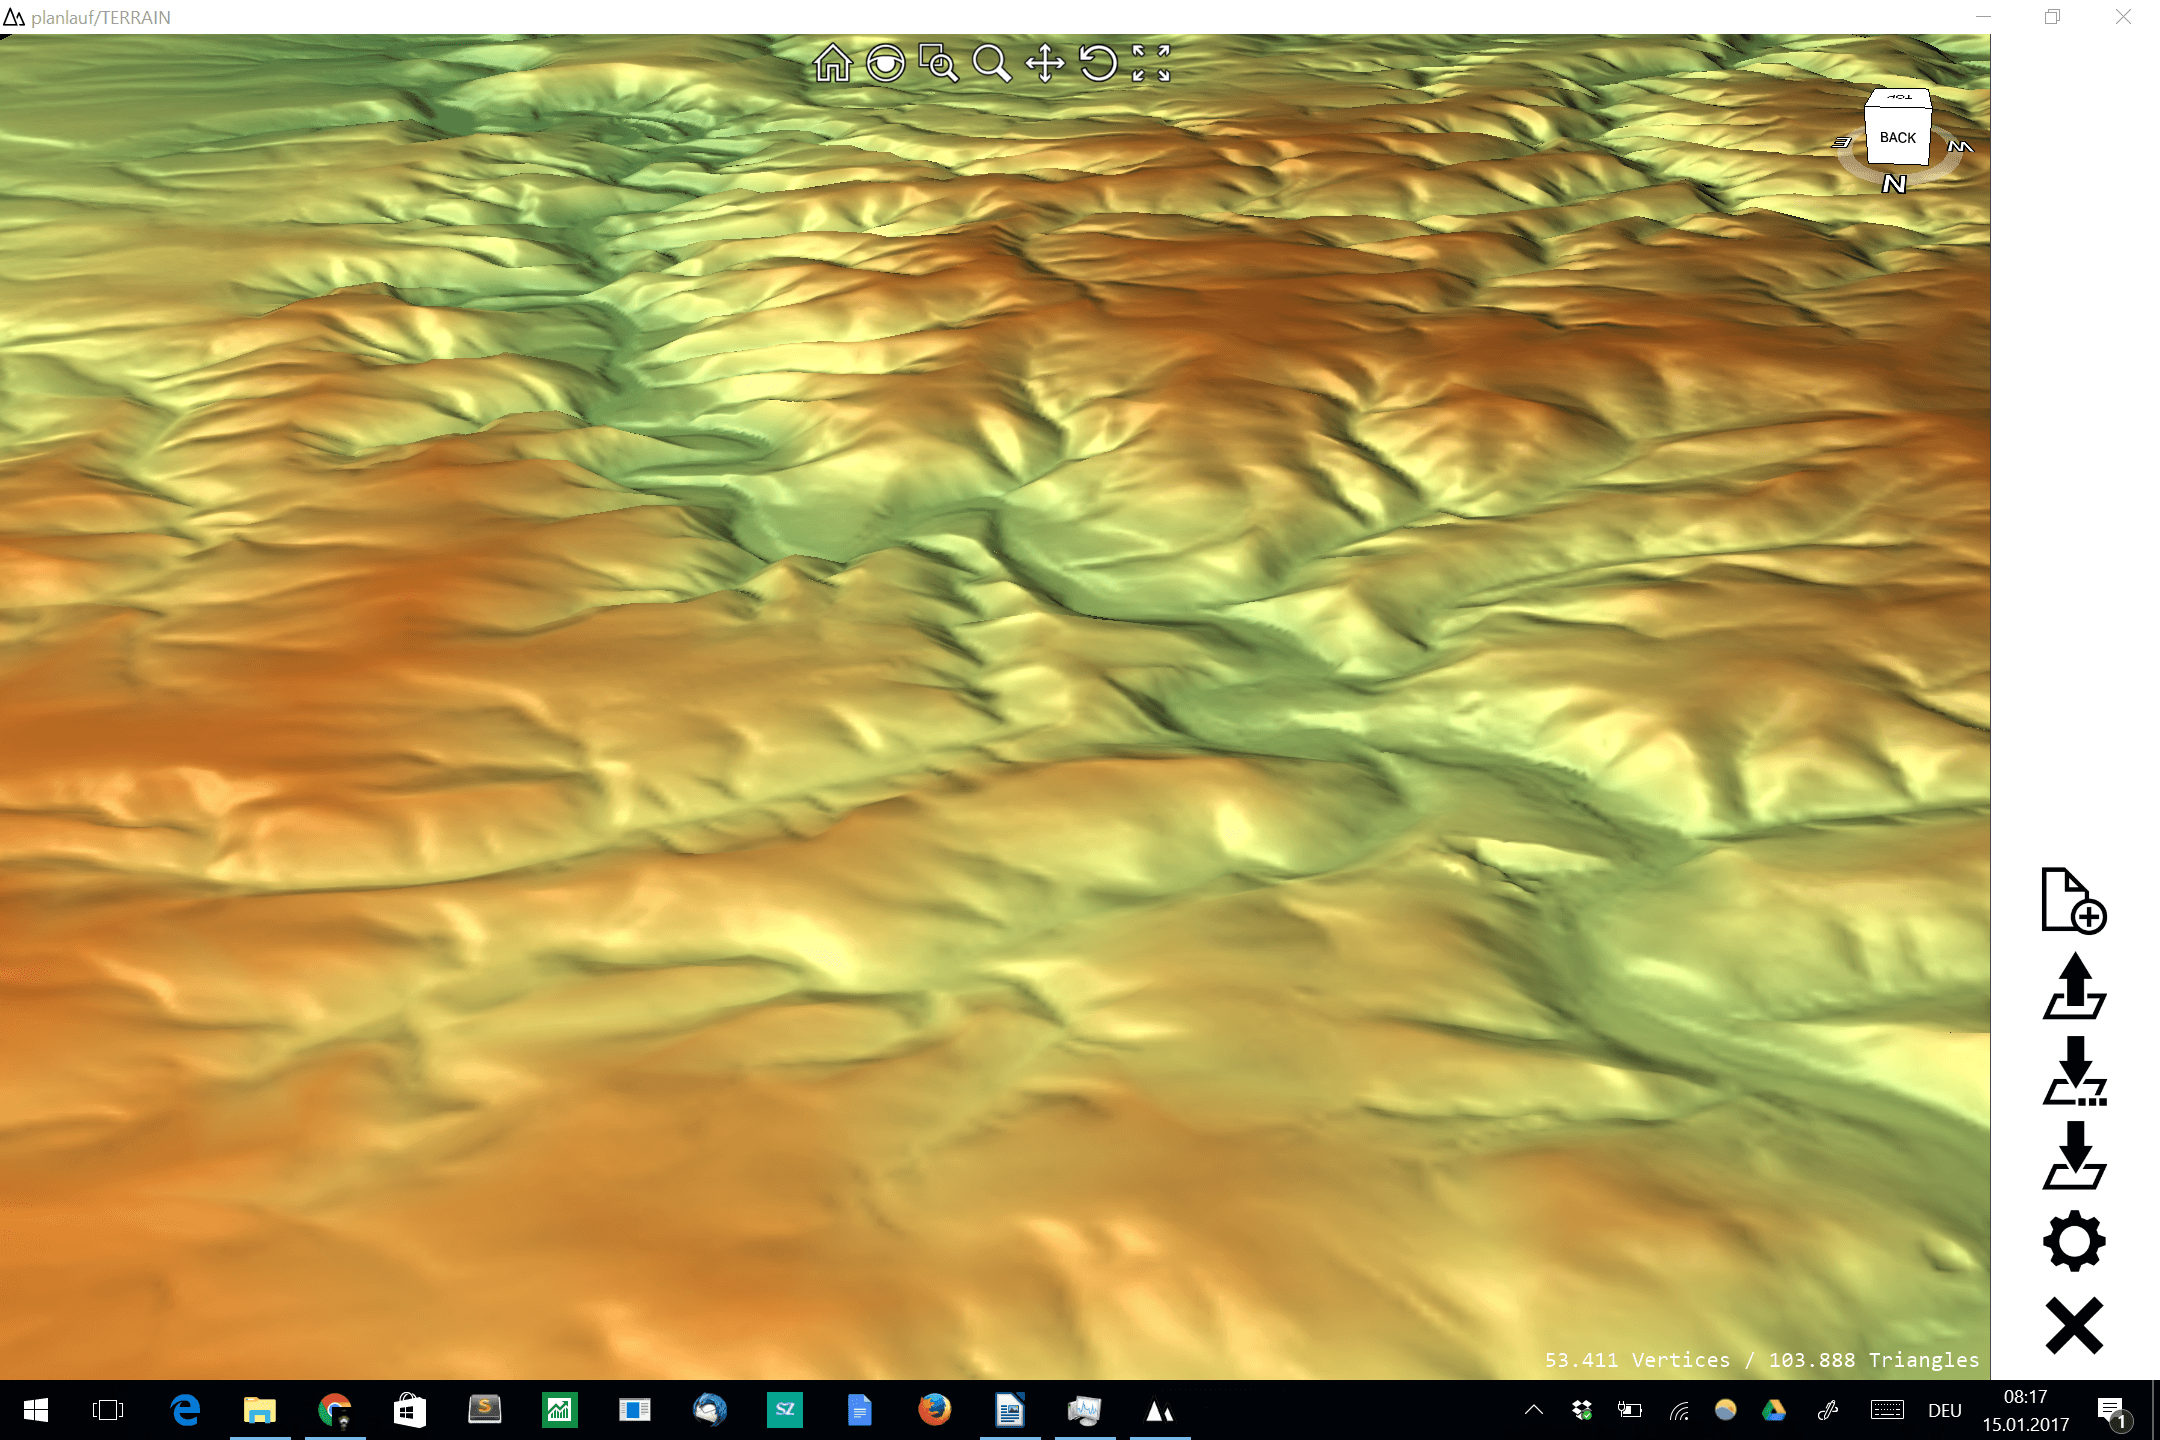
The visualization and interpolation of 3D terrain (point) data (DEM or DOM) could be a hard task for current GIS software and small to midsize hardware. One thing is the huge possible amount of points and their precision when it comes to airborne or terrestrial LIDAR data with point density < 5m and big areas of interest. Another thing is the rendering performance once the user started his exploration of such a huge dataset. There are several open source and proprietary software solutions and specialized software for several industries. In the following I’ll introduce you to planlauf/TERRAIN, a lightweight DEM viewer for daily usage which is a great free-trial tool for smooth presentation and exploration of datasets with a good usability.
Background
planlauf/TERRAIN is developed by planlauf GmbH, a German company specialized on the simulation and measurement of machines and machining processes. I think it’s a great chance for geodata applications when such solutions are developed across sectors. Their new DEM viewer is currently available for Windows 7/8/10 only and is downloadable as 30 days free-trial version.
Technically the application is a combination of a high performance gaming graphic engine and mighty open source libraries like GDAL and others.
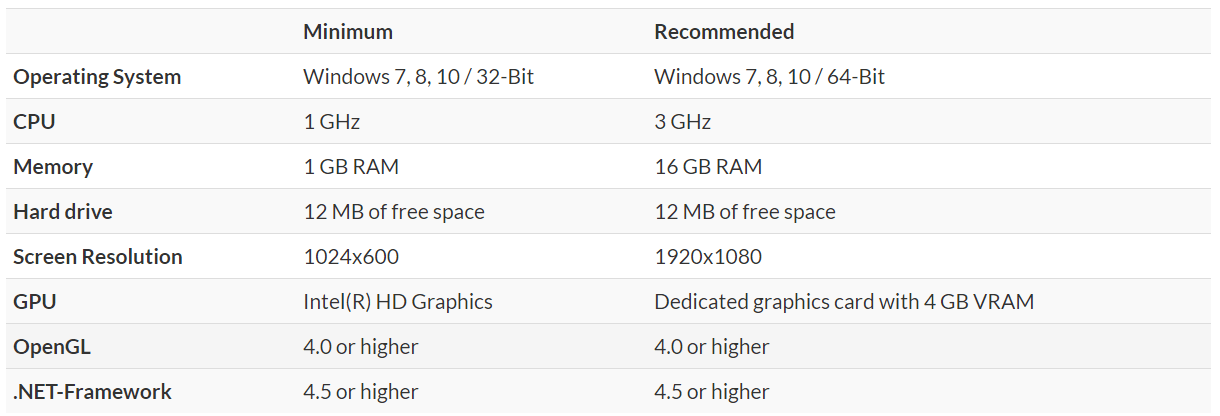
planlauf/TERRAIN requirements
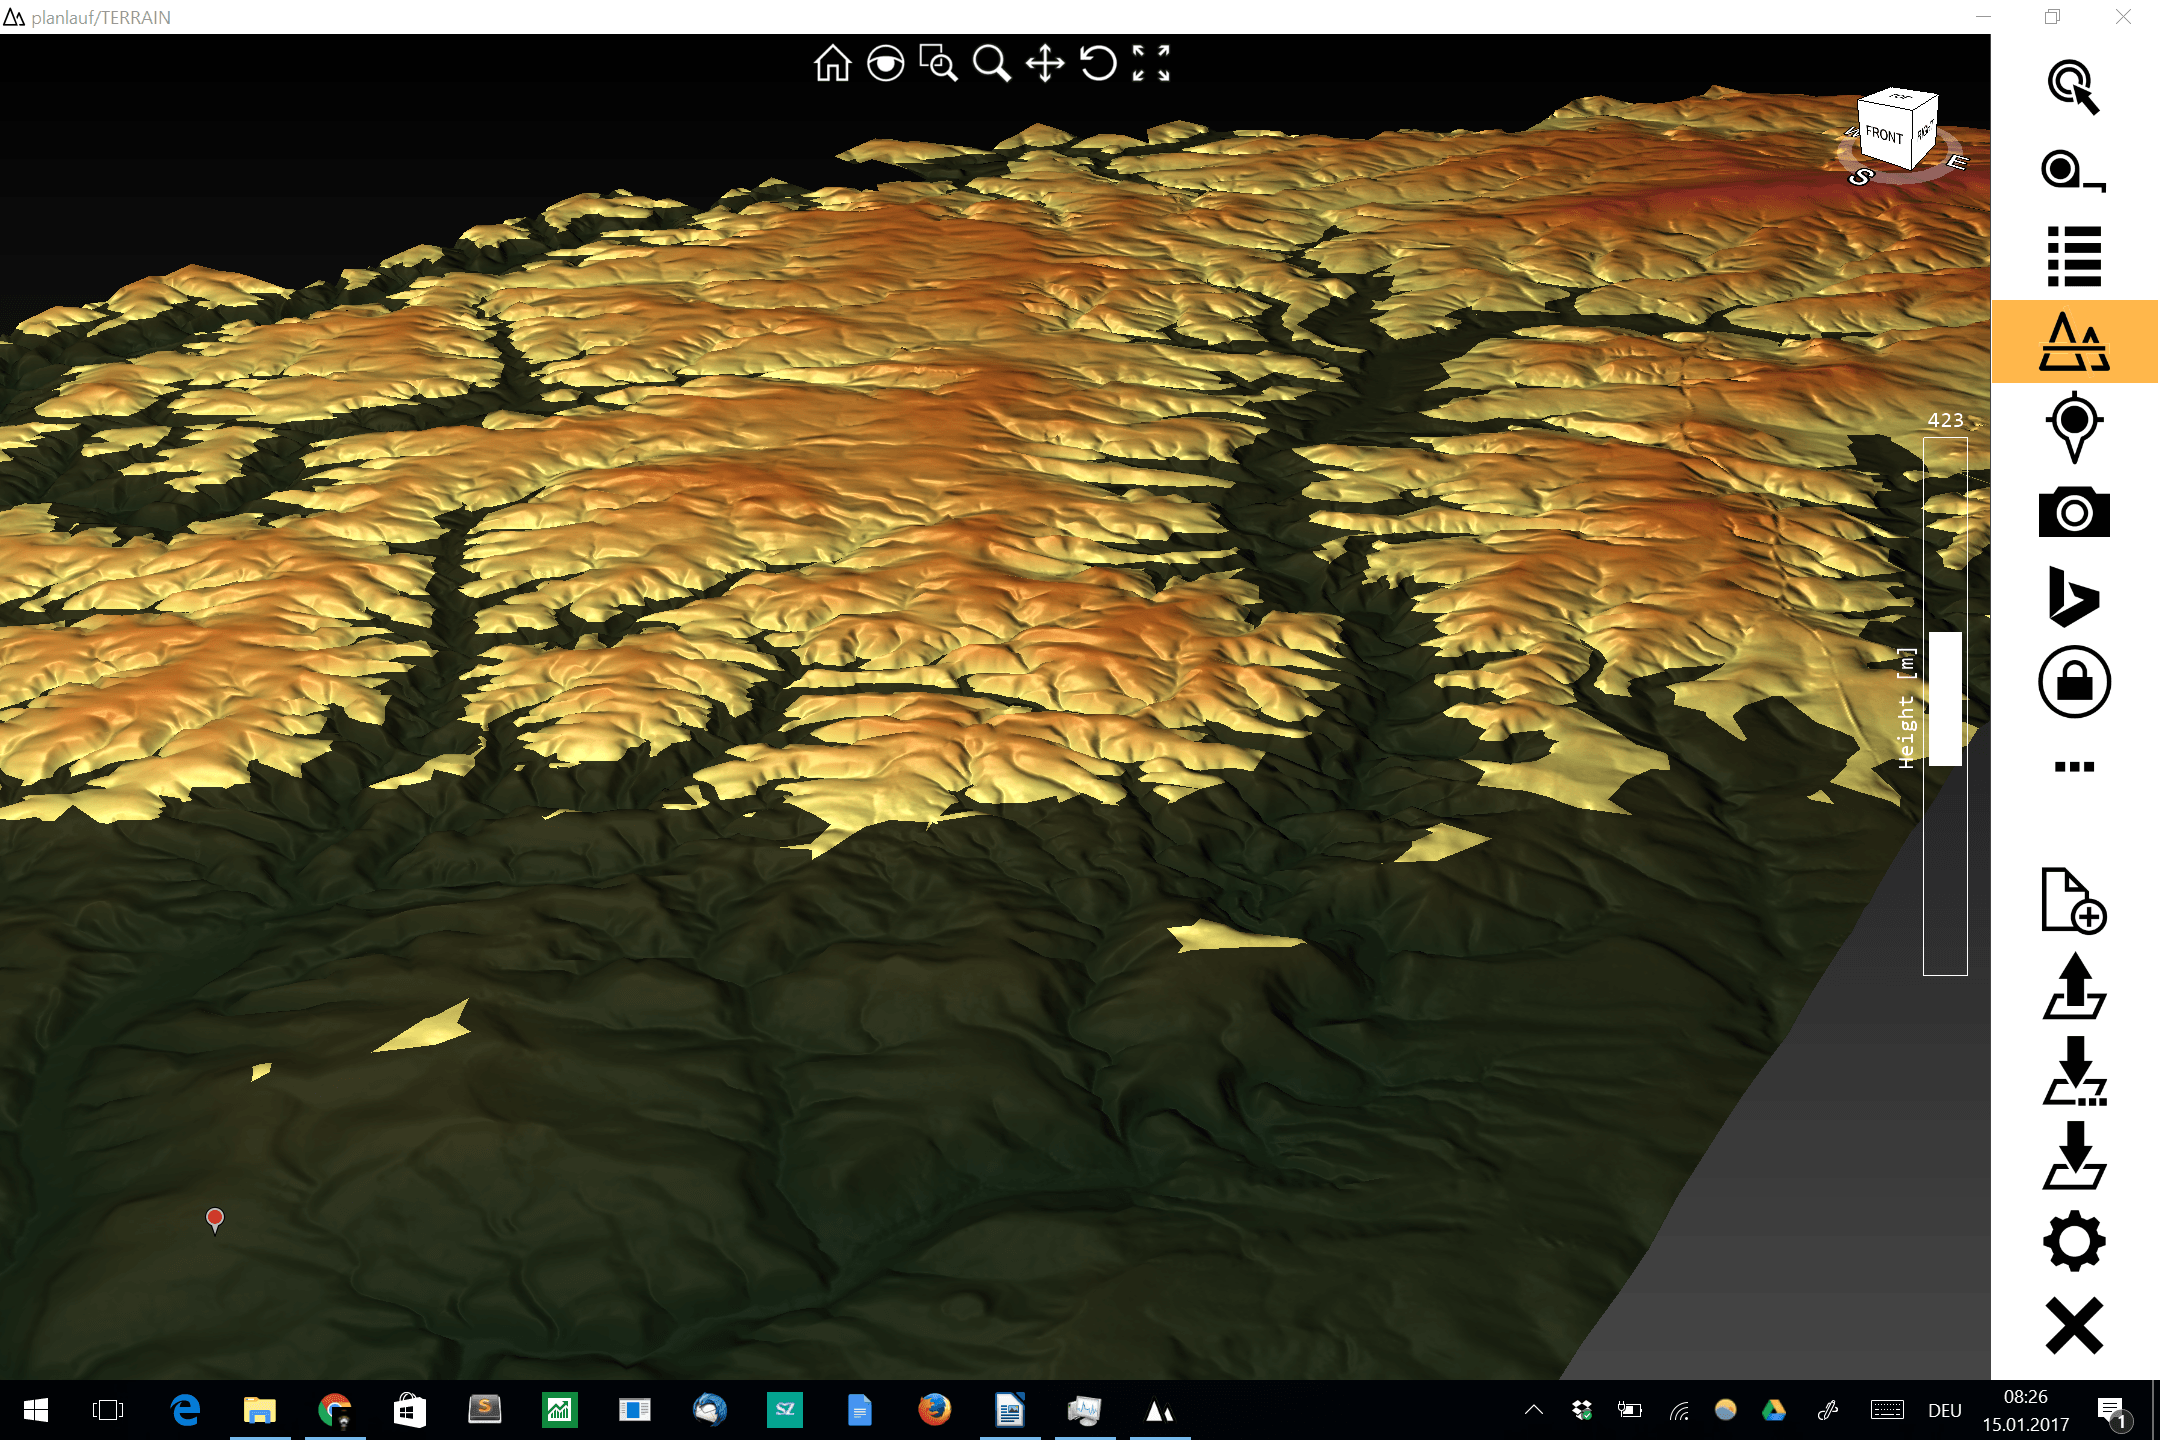
Quick start DEM visualization
- install planlauf/TERRAIN by using the downloadable free-trial version
- load data
2.1 For this article I choose DGM 25 (format: ASCII (X, Y, Z)) as sample data from Rheinland-Pfalz, a state of Germany. Of course a sample visualisation could also be done with your own datasets. After downloading the test data, unzip it.
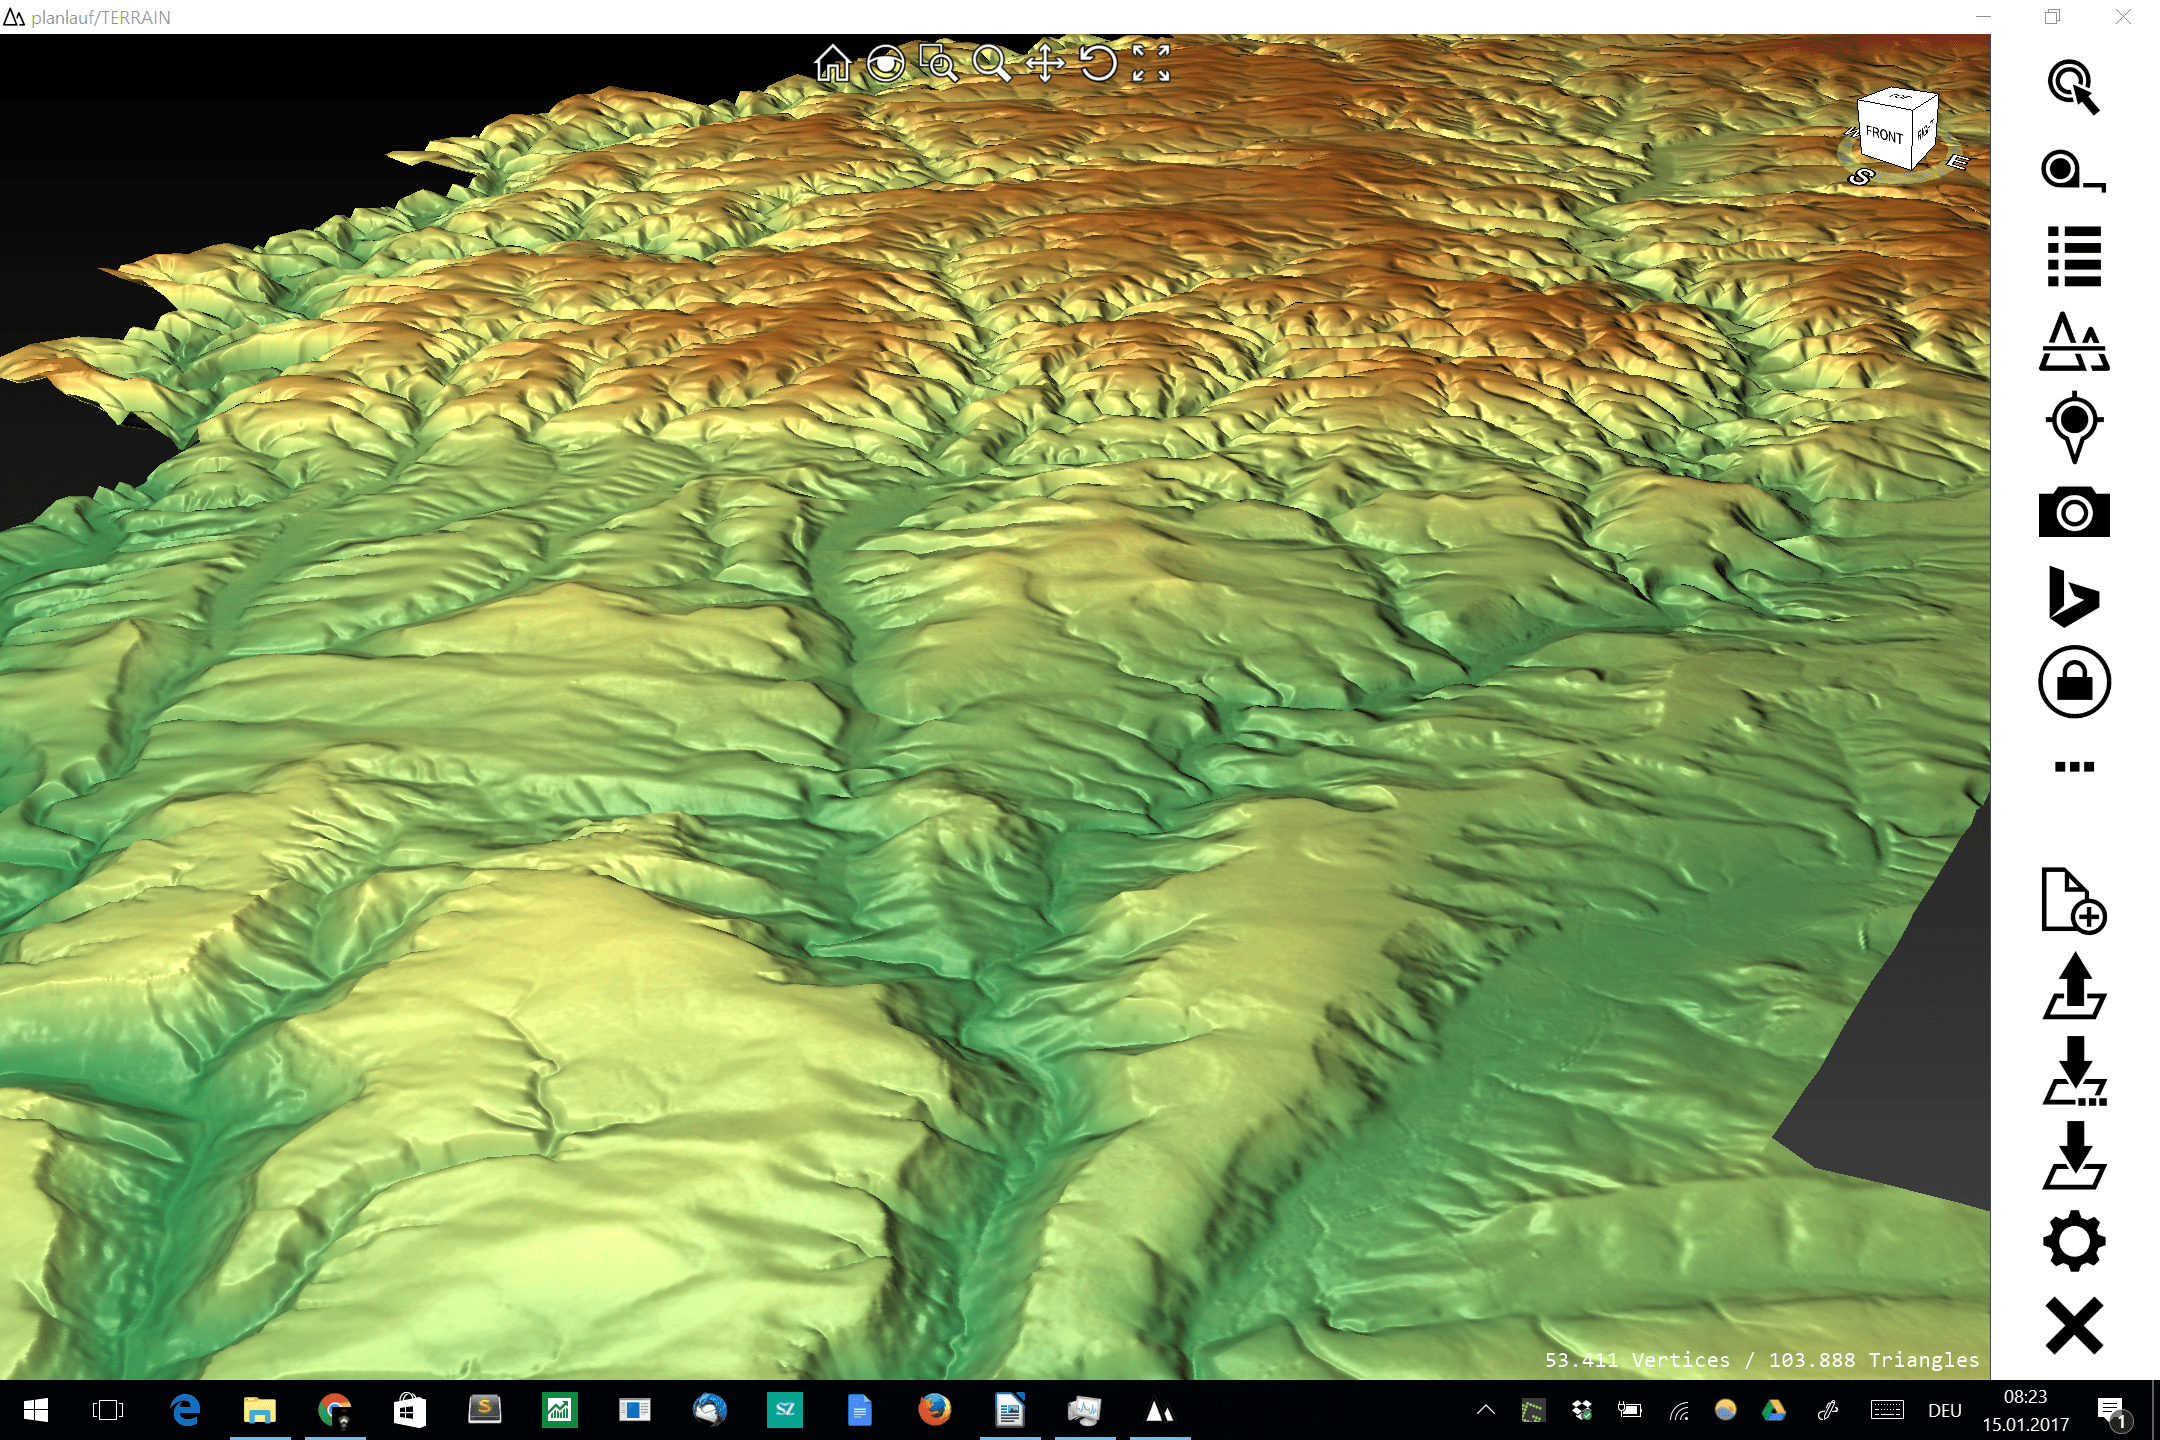
2.2 Start planlauf/TERRAIN, click on “Open” and select the xyz datasets (depends on your sample data). After that the software imports the data, asks for projection details and creates a 3D mesh incl. mesh decimation. - navigate
The panning and zooming of the created 3D model is really easy. Just use the box-model on the top right position and your mouse-wheel, or use your touch screen. I tested it on a Surface Pro 3 and it was really easy to zoom and pan the view by hand. - height profile
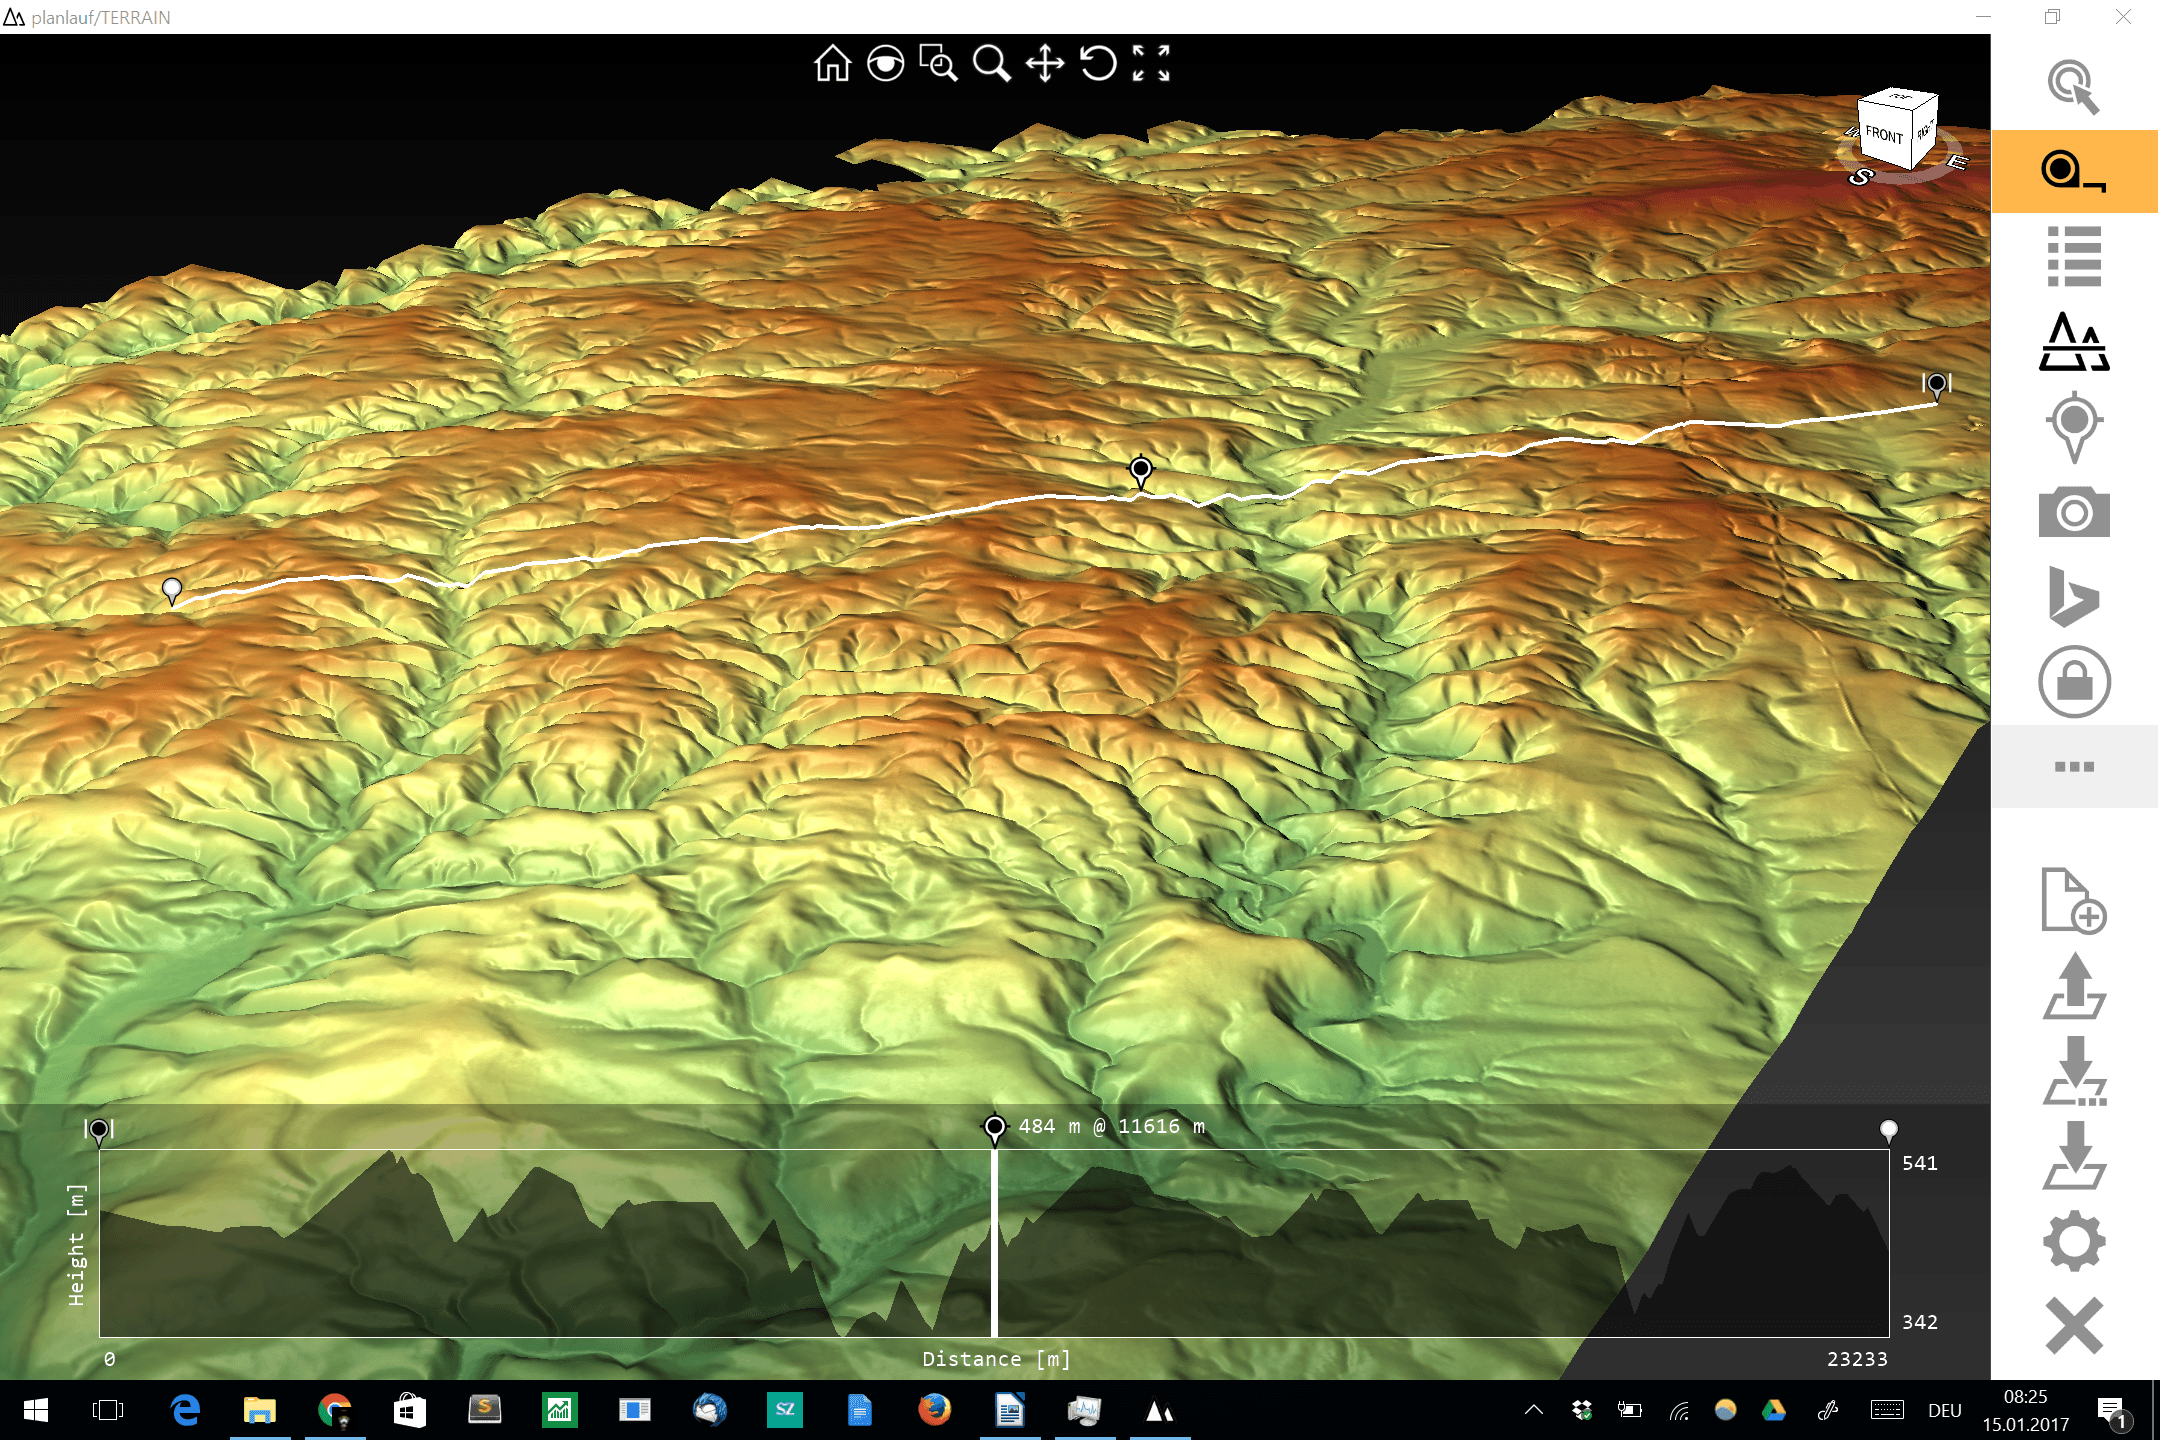
planlauf/TERRAIN comes with neat features to be productive with your auto-colored 3D model terrain data. One function is the measuring tool, which creates height profiles and a 2D-visualization. - plane
Another practical function is “plane”, where you can fade down levels of height to concentrate your view on a particular part of the 3D terrain model. - pins and tracks
You’re able to im- and export pins and GPS (GPX)- or manual tracks including photos and meta information and show it on the 3D model. - more
Of course there are still more features to explore. Please check out the full feature list.
Results of the quick start session
This video shows you the main functions in action:
Hands on review
Let’s come to a conclusion about this 3D DEM viewer. To my mind planlauf/TERRAIN is a lightweight software for non-GIS users to explore 3D model data, show related meta information and create project documentation datasets (pins incl. photos, height profiles and much more). Another great advantage is the easy user interface and great rendering performance which makes data presentation comfortable even as live content in a presentation. The small time effort to import and visualize height data is an advantage but also depends on your used hardware. To my mind the performance of creating a model and rendering everything is really good – please comment your perception. On the other hand there isn’t any GIS interface for the mesh, which could be very useful. Indeed, with “Crater Detection” planlauf implemented a first DEM analyse feature – for further investigations more tools or the already mentioned GIS interface is crucial needed.
Conclusion
This software is interesting for everyone who’s dealing with spatial related 3D terrain data with focus on data presentation and quick (meta)data maintenance. I could think of quick in-situ data checkup after laserscan sessions and scientific approaches to organize field work. Also it could be very useful for property business with upcoming BIM solutions or other LIDAR point clouds based applications. Further development milestones could be a GIS-ready wireframe export and a function to create an embeddable web visualisation output (powered by 3D javascript libraries) to implement calculated 3D models onto websites.
Get the software: http://www.planlauf.com/de/planlaufterrain/download-purchase/

Nice share , is other option to get and visualized 3D information, thks