To map excel data onto a print- or webmap is one of the most needed and chosen data preparations. Companies and scientists are often highly interested in located table datasets on maps. In this how to I’ll show you, that this job could be done with free and open source software like QGIS.
What do you need to map excel data?
- a table with some data columns (one city- and street-row is necessary)
- excel or open office or libre office or something else
- QGIS (free open source GIS-software)
- 10 minutes
1. georeferencing your point data
In this step we create geographic coordinates (decimal x- and y-values) for our address-row of the input table dataset.
First we need to import our datatable into QGIS. I’ll use this test dataset.
| city | street | customer | product | output | buydate |
|---|---|---|---|---|---|
| NewYork | 355 W 16th St | Peter Pan | shoes | 50000 | 01.02.1988 |
| London | Whitehall Place | David Hasselhoff | guitar | 10000 | 02.10.1985 |
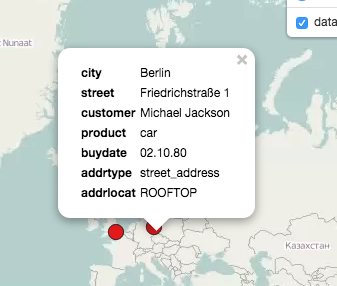
| Berlin | Friedrichstraße 1 | Michael Jackson | car | 3200 | 02.10.1980 |
Now follow these steps:
a. Save your excel datasheet as .csv (comma separated values) like this:
data.csv
city,street,customer,product,output$,buydate
NewYork,355 W 16th St,Peter Pan,shoes,50000,01.02.88
London,Whitehall Place,David Hasselhoff,guitar,10000,02.10.85
Berlin,Friedrichstraße 1,Michael Jackson,car,3200,02.10.80
b. Open QGIS
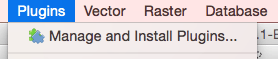
c. Install the mmqgis Plugin

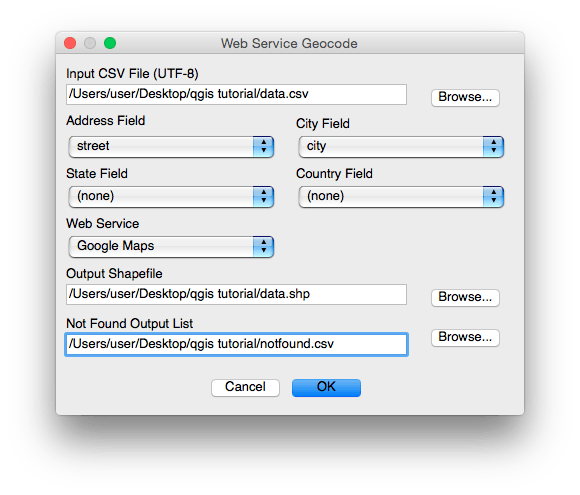
f. Geocode your table with mmqgis

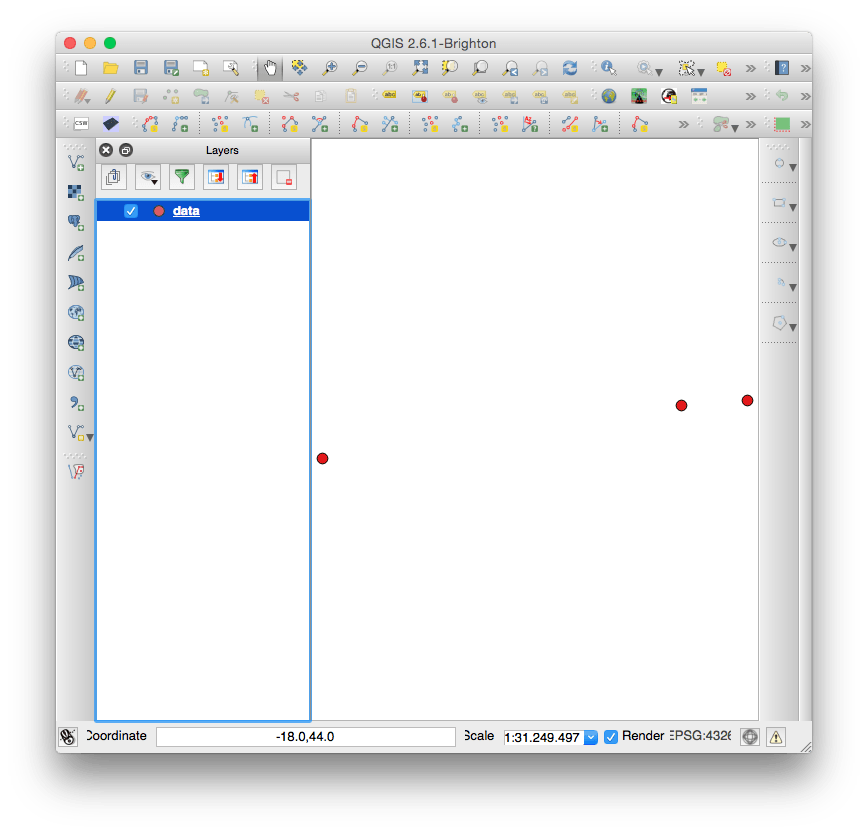
3. show it as map layer
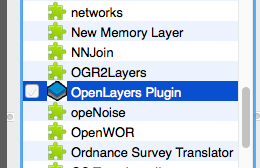
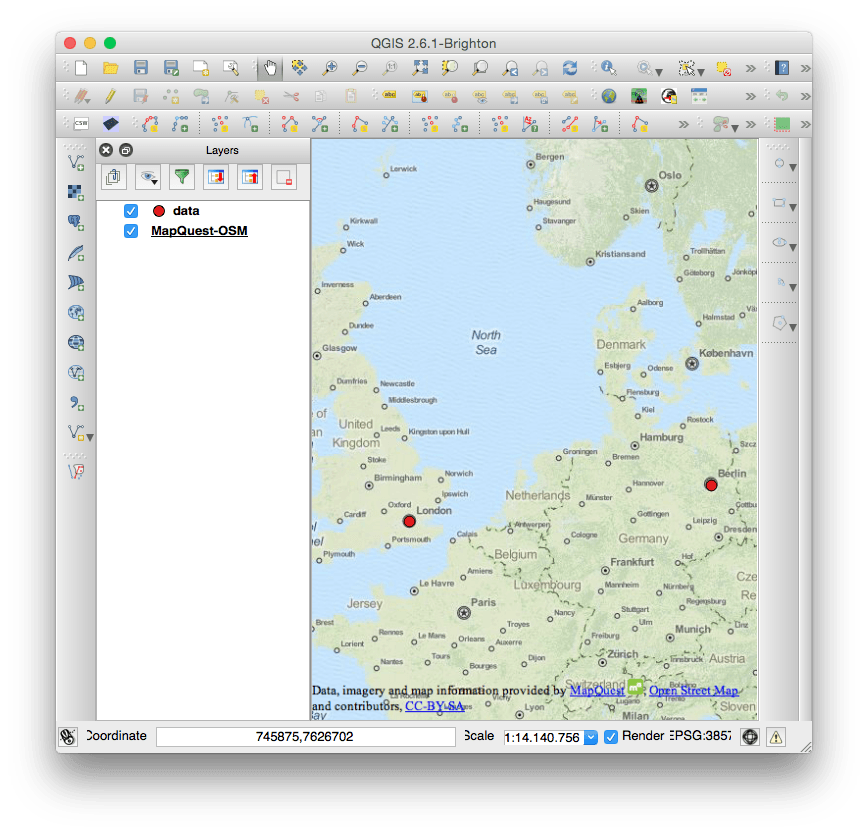
For showing your new map features on top of a map you only have to import a webmap baselayer. The plugin “Open layer plugin” is very helpful in this case. Just install it in the extension manager like mmqgis Plugin described at point 3. After installing this plugin press “Web – Open Layers Plugin – MapQuest – MapQuest OSM” and gain the following map result.
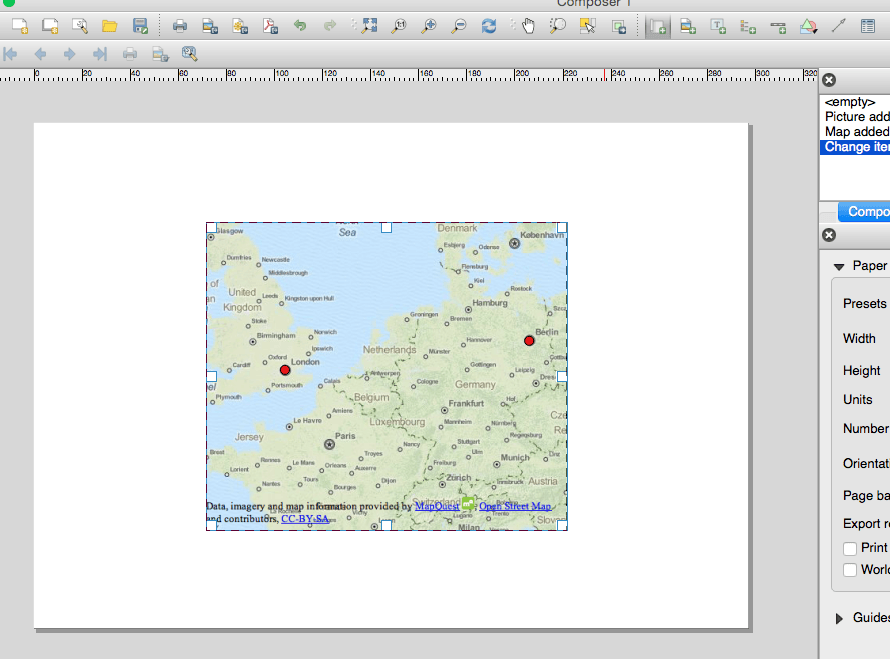
4. export your map data as a print map
Now open the QGIS Map Compose, click on “Add a new map” and draw a rectangle on the white canvas. After that you’re ready to export the result as raster- or vector-pdf file.
5. export your map data as a webmap
If you’re interested in creating a webmap, use our QGIS2leaf Plugin for an easy webmap creation. Install it from extension manager (“QGIS2leaf”). Start the plugin, “get layers” and export your first data driven web map with your own company data.


Help
You need professional help in creating proper and modern webmaps, which shows your business data – get in touch with us!


This is great example. I usually use ESRI excel plug in but this is much better option to use when you don’t have ESRI license. Thanks for the share!!
Thanks!
Great example in deed and well displayed.
May I ask you for something extra? How easy it is to add a distance tool in this kind of webmap?
Do you mean a distance measuring?
Yes!! Distance measuring tool!!
check this leaflet plugin: https://github.com/jtreml/leaflet.measure
Thanks. I will have a look!
nice tutorial, one thing to add: after saving the csv file in excel it
needs to be formatted in UTF-8 (especially when dealing with special
sign like ß or something like that) else MMQGIS will bring up an error
message. I didn’t found it in excel settings how to save the csv file in
utf8 as default, so i did that with notepad++ afterwards. greetings
maadin
Thanks! I’ll will add this information.