Today Aleks blew my mind with a feature on a preview addon for Microsoft’s leading spreadsheet software Excel: The Power Map Plugin. So Let me show you a quick example and describe my recent fallbacks. For this purpose I used a list of worldwide skyscrapers and their places in the world.
Where to get it Power Map?
The Power Map plugin/add-on seems to be a little older with regards to this video:
Yet it was new to me and you can download the preview (why is there no progress in status?) on the Microsoft pages. It is a small plugin of about 12 mb but it will give you some great opportunities in Excel without the need of a separate GIS. Yet you will need to be connected to the web to use all the functionalities.
The Power Map plugin will be placed inside your ribbons in Excel and have to possibilities: start it and add data to it…
Using Power Map for Excel
As I’ve already mentioned I am using a list of skyscrapers from Wikipedia (here is my clean-up version of it as xlsx) and I would like to create a nice map of it. Normally I would upload the csv to QGIS/ArcGIS and use a geocoder to geolocate the cities in my GIS. Not with Power Map. After starting the plugin you will see a nice globe:
Power Map splash screen
What is interesting: Microsoft Power Map don’t use bing maps as basemap (:-/)…
As we have the list of skyscrapers in the spreadsheet let’s add this data to the map. Please keep in mind that the only information we have is the city and the country. So as we add the layer Power Map asks you to determine the geometry columns and lets you determine the type opf the column. In my situtation the city names in the colums city are of course cities and countries are countries. SO far so good. I’ve tried it as well with German streets and the geocoding was a disaster. This said: Power Map determines the location of each row by the city and country:
geocoding report from Power Map
Now, all my entries are shown as small dots on the map as I have not decided which column to use to style my markers…
places on the globe
Once added, I decided to use the number of scyscrapers as the source for the height of a bar, but this was failing a s all bars had the same height (it seems like he interpreted the number of skyscrapers as category….):
numerical values fail
But I was lucky switching to rank:
rank of a city regarding the # of skyscrapers
But let’s switch the visualisation a litte and add the labels of the basemap:
plane view with tilted map in “3D”
If you don’t like the standard design you can simply switch through:
GIF with styles
You can add legends as well as simple bars to your map and also create videos out of your map.
Summary
Power Map is a simple tool to geocode rows in Excel based on city granularity which lacks to geocode (maybe only German) addresses. Yet you can create intersting and detailed maps using Here basemaps.
Till now, I saw major problems in aggregation of rows (my cities were displayed only aggregated to a country after a while). Furthermore the interpretation of numbers as real absolutre and not categorized values was false.
Still I like the easy use for people who don’t want to get to know a GIS and its capabilities but also want to create a “map” the easy way.
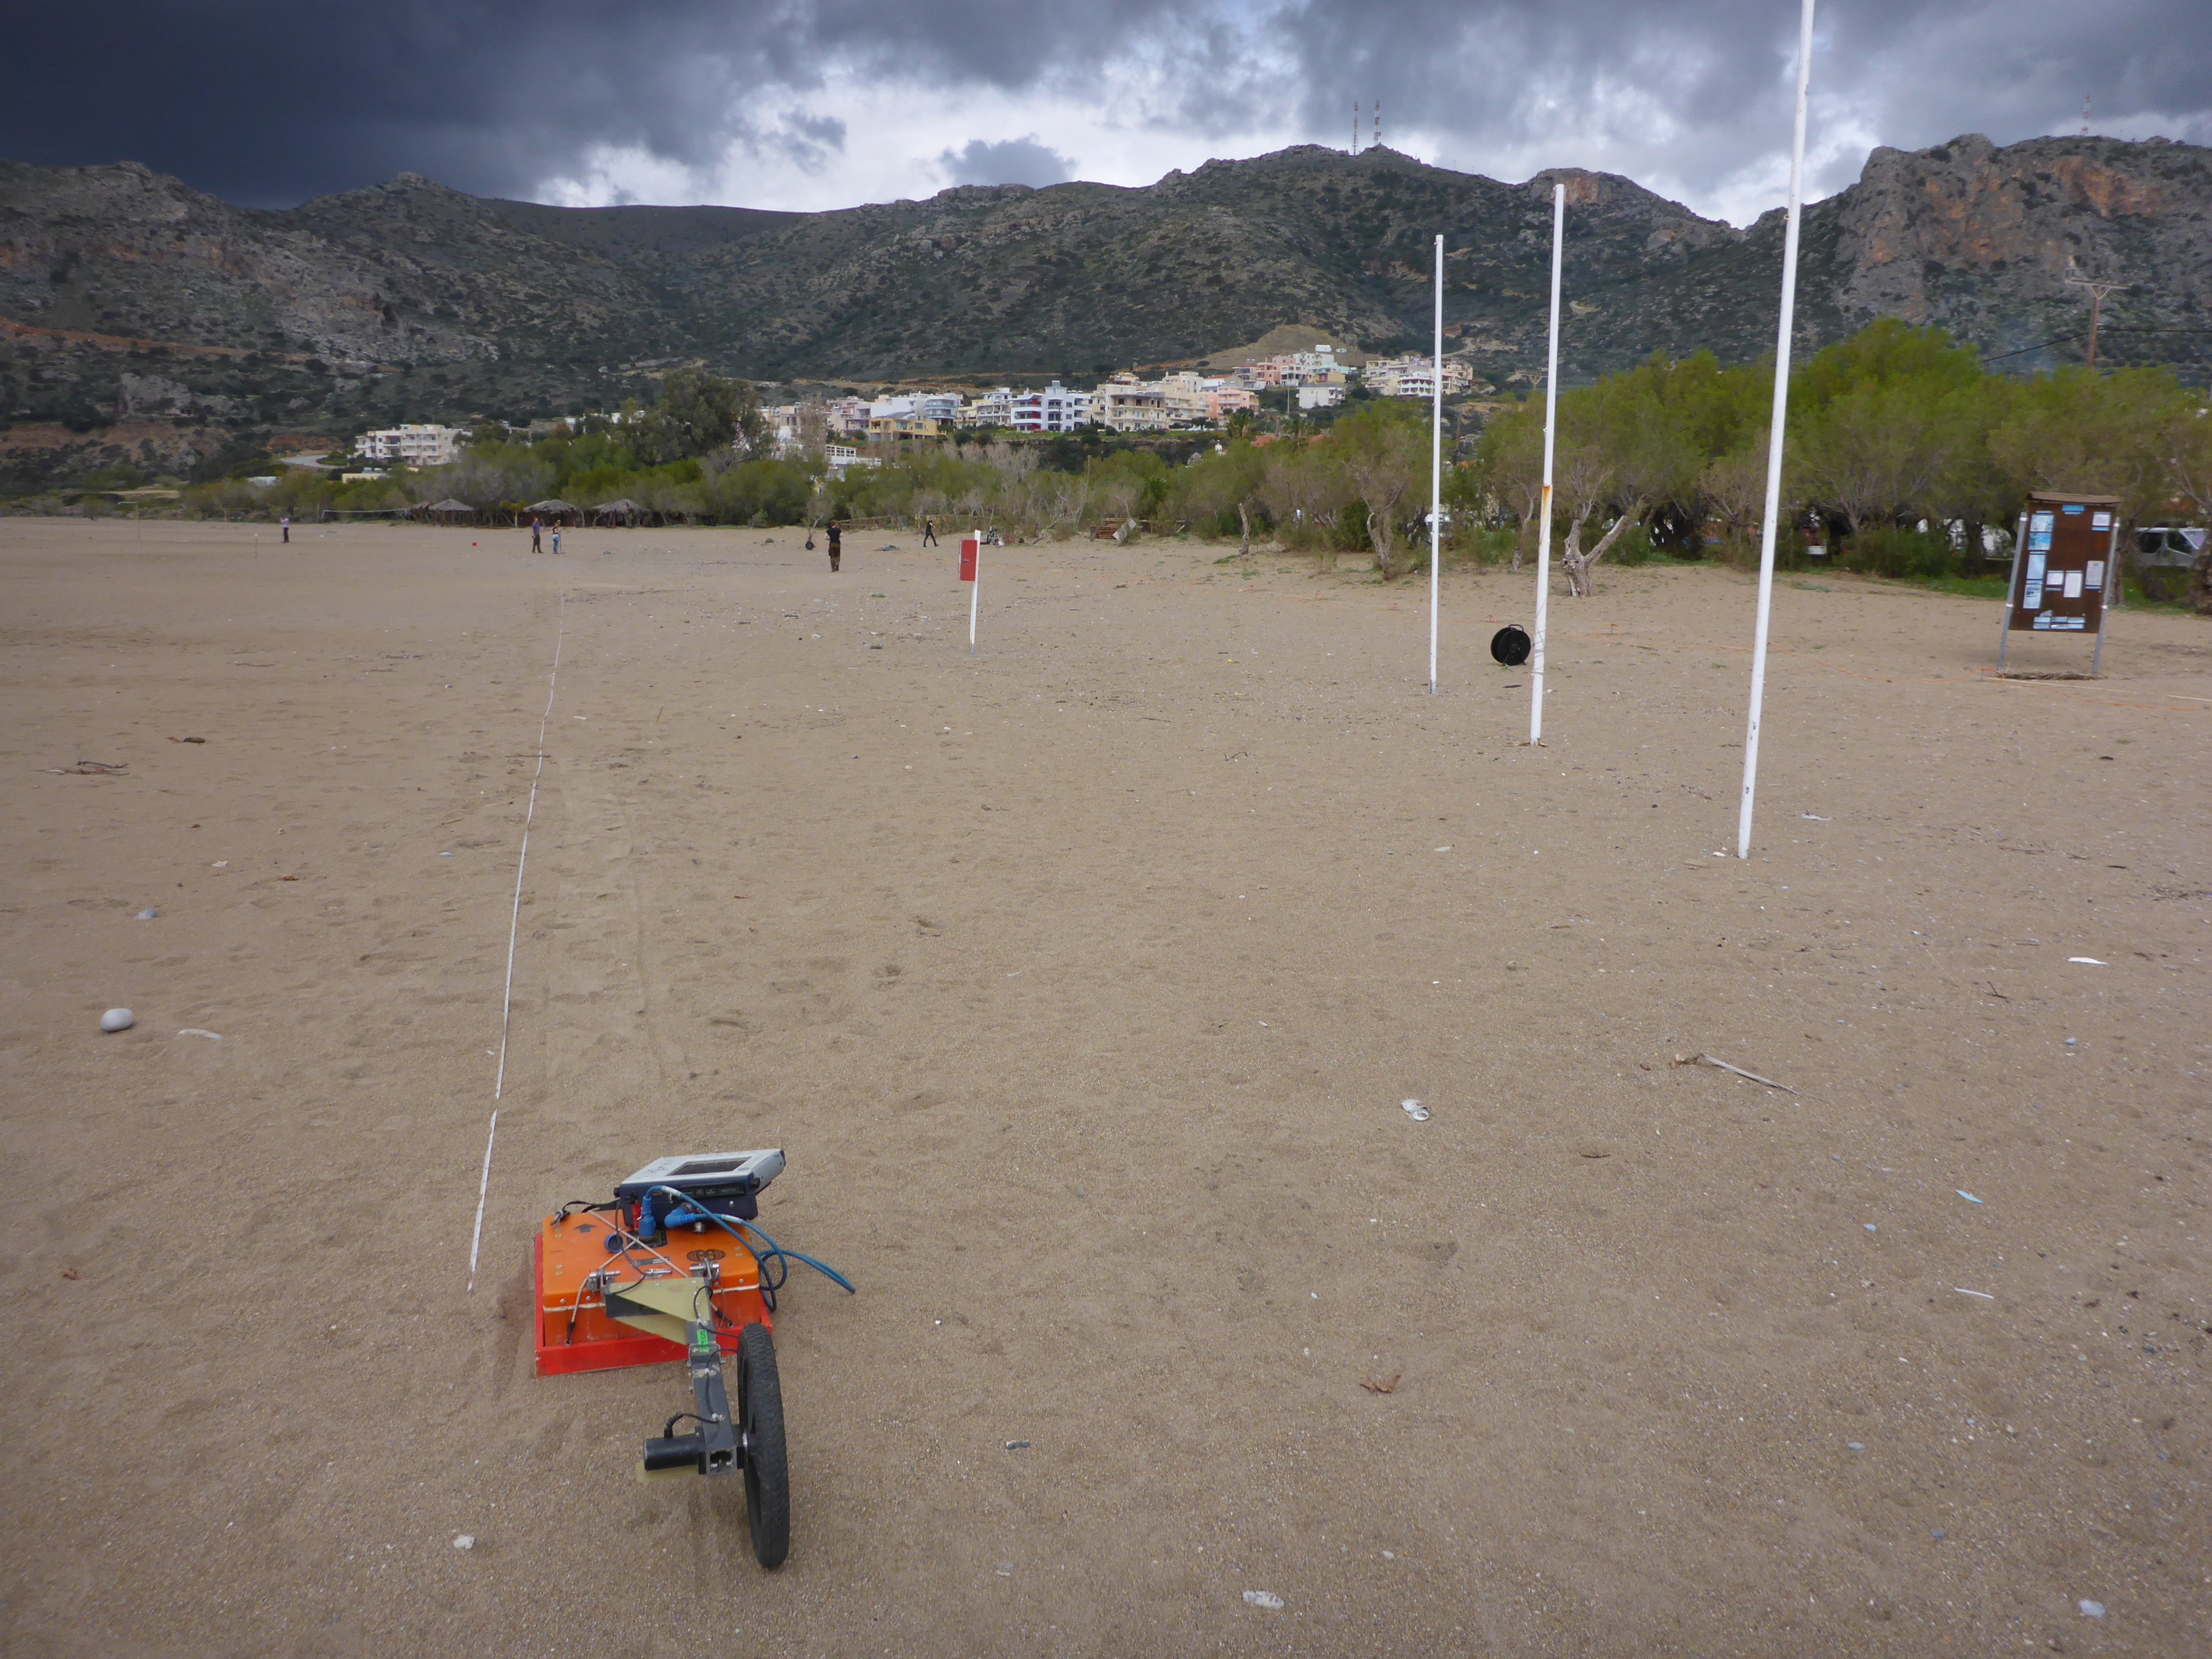
When you’re in the field you want to collect as much data as possible using all the expensive and heavy equipment you brought with. For instance, geophysical profiling…
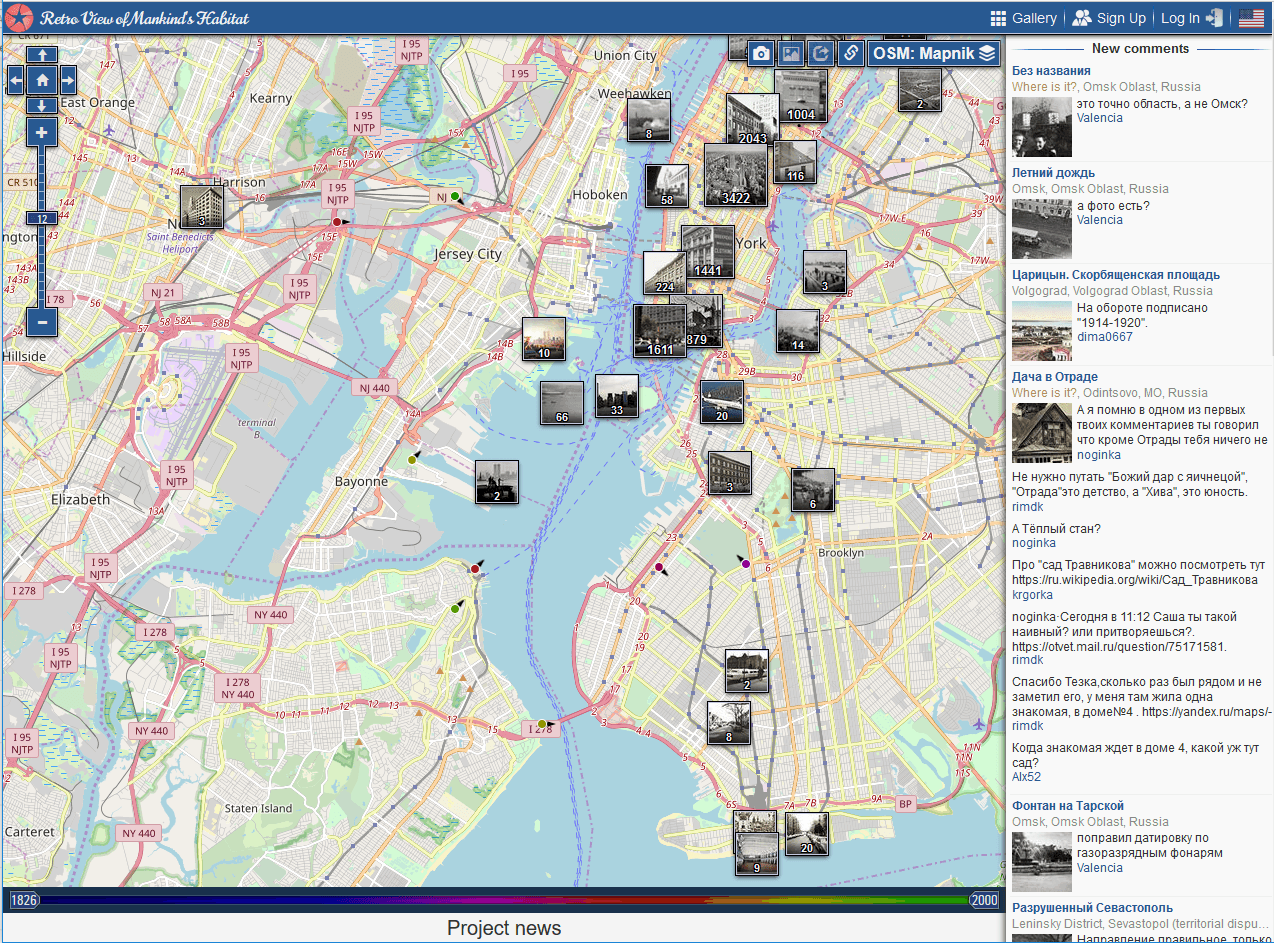
Once in past there was a project called Panoramio were you uploaded your photos of landscapes or places around the world and it was explorable via a map.…
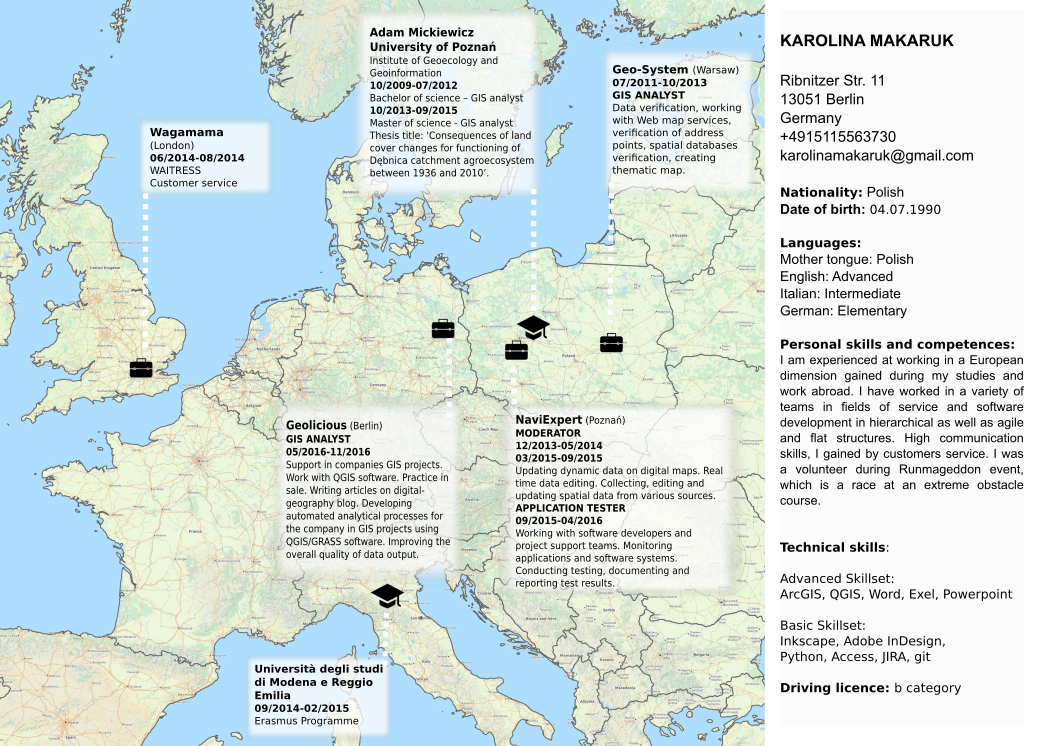
Probably everyone at least once in your life was searching for a job and had faced the challenge of creating an interesting resume. But when you start to…