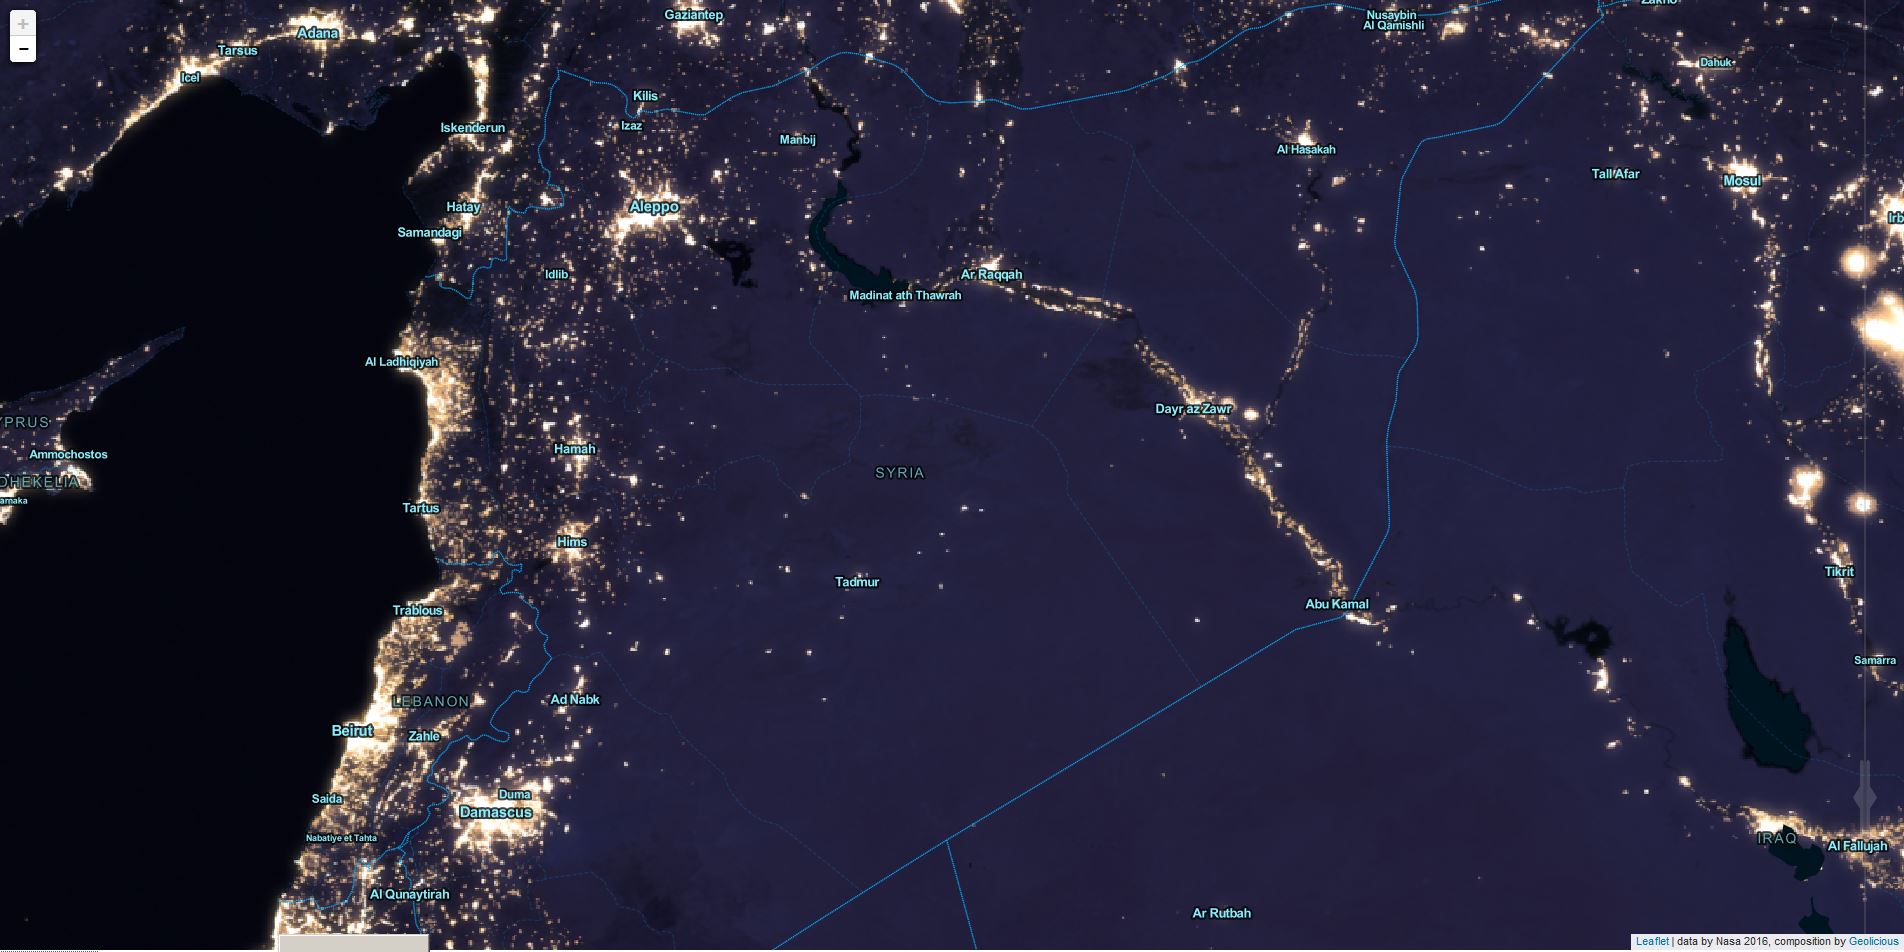
Some days ago NASA has released “Black Marble”, an image of the world by night, a combination of photos taken by a new satellite. Its name was chosen according to the “Blue Marble” image, released several years ago. I like this very much and I decided to make a nice map from it in Tilemill and publish it here. If you want to know how I did it, read on.
You can see the map in original size here
Step 1
First I downloaded the “Black Marble” image from the NASA website. You can get it here.
Step 2
Now we have to style our map in Tilemill. If you don’t have Tilemill installed yet, head over to the installation instructions.
Let’s open Tilemill now and create a new project in the projects overview page. Otherwise you can take the existing “Control Room” project and customize it to your needs.
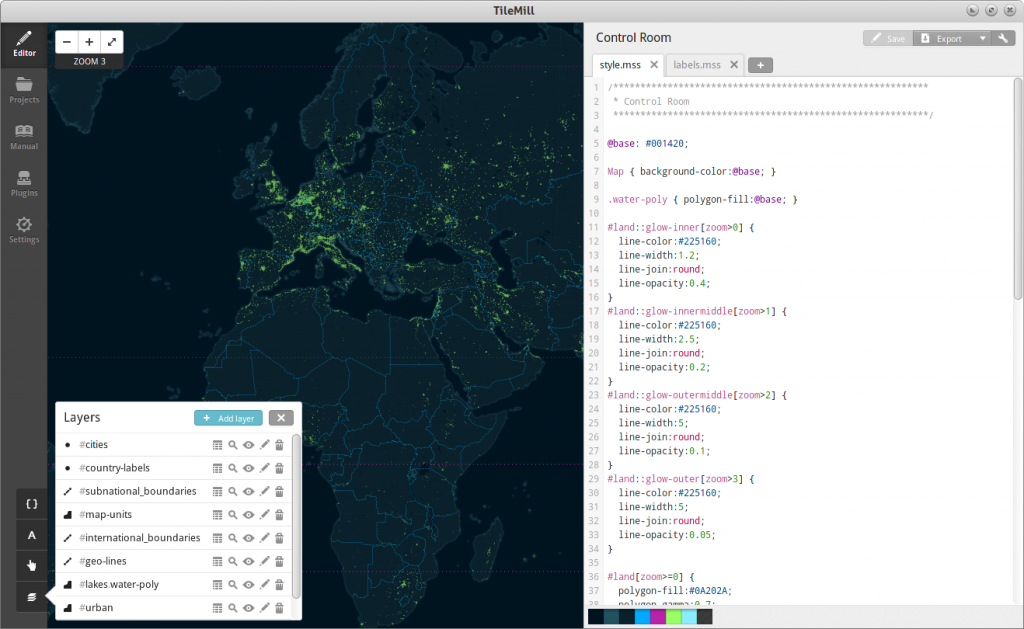
When you opened up your project, you can see a code editor on the right. There you can use the CartoCSS styling language to define the visual properties of your loaded layers. But first, we need to load the NASA Black Marble image. So click on the layer symbol to the lower left in Tilemill and then “Add Layer”. In the appearing dialog, you can now give a name for the new layer and specify the path to the satellite image. Now you can hit “Save and Style” and you will see some code at the bottom of the code editor. Because we don’t want the image layer to be on top, overriding the other stuff, you can drag and drop the freshly added layer in the layer dialog under #geo-lines. Now hit the “Save” button on the top right corner and after some seconds (be patient) you should see new map. You can go on and delete or customize every layer you want.
At the end, go to “Export > MBTiles” and choose some settings for the export. I highly recommend to render no more than 8 zoom levels, except you have a really fast machine under your desk. On my quad core machine with 4 GiB RAM, rendering took some hours, so be patient. After the rendering processed has finished, you can save the MBTiles somewhere on your drive and head to the next section.
Step 3
Obviously, if you want to serve some tiles on the internet, you should have some server capacity. Otherwise you can still provide the MBTiles in raw format and give them to your colleagues for displying them with the Mapbox iPad App. But here we want to continue with our little how to.
After we have uploaded the mbtiles to our server, we have to convert them to a structure of directories containing the tiles as PNGs in the format z/x/y (Zoomlevel/X-Columns/Y-Row). There is a handy tool called “mb-util” doing this for us, but we need to install it first via python packages:
pip install mbutil
Now we can unpack the mbtiles to the desired directory on our server. Note that the directory will be created by mb-util, there the directory must not exist at the moment running mb-util.
mb-util path/to/my.mbtiles path/to/tiles/my-map
Now you can set up a page displaying your map using Leatlet.js. Note that Leaflet gets loaded by the client itself, therefore its just a link to the code. In line 2 of the javascript code, you can specify the directory where you unpacked your mbtiles.
My Custom Map
<!--[if lte IE 8]>
<link rel="stylesheet" href="http://cdn.leafletjs.com/leaflet-0.4/leaflet.ie.css" />
<![endif]--></pre>
<div id="map" style="width: 100%; height: 100%; position: absolute; top: 0px; left: 0px; margin: 0px; padding: 0px; z-index: 0;"></div>
<pre>
<script type="text/javascript" src="http://cdn.leafletjs.com/leaflet-0.4/leaflet.js"></script><script type="text/javascript">// <![CDATA[
var map = L.map('map').setView([0.0, 0.0], 1);
L.tileLayer('tiles/{z}/{x}/{y}.png', {
attribution: 'Map data &copy; <a href="http://openstreetmap.org">OpenStreetMap</a> contributors, <a href="http://creativecommons.org/licenses/by-sa/2.0/">CC-BY-SA</a>',
maxZoom: 8,
minZoom: 1
}).addTo(map);
// ]]></script>
Now you can customize the map properties by adjusting the parameters inside the javascript block, for example the default zoom level at load time (setView([x,y],z). For the complete documentation, have a look at leafletjs.com
That’s it!
I am curious why you took this approach over serving the tiles with tilestream, django-mbtiles, python-mbtiles or another server solution?
Thanks for the other alternatives! I would give Tilestream a try, but it needs an older version of node.js than I have installed on the server. But next time I’ll try the other options.
hello That’s a nice post.