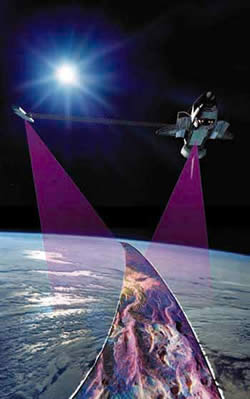
InSAR (Interferometric Synthetic Aperture Radar) is one of the greatest remote sensing tools for everyone interested in crustal movements. The principle is simple: A satellite equipped with a radar device is constantly measuring the topography of the Earth while orbiting. When it crosses the same area a second time, the two datasets can be compared and the changes in altitude can be measured. The fascinating thing is that these changes may be as small as < 1 cm, using the interferometric effect! Repeated measurements allow creating time series and monitoring areas with crustal deformation. Such deformation can be caused by earthquakes (e.g., De Natale et al, 2011), volcanoes, landslides, karst, tectonic uplift/subsidence, mining, groundwater extraction etc. The data is commonly displayed using so-called fringes, rainbow-coloured rings indicating positive or negative variations of the topography.
One of the best animations for visualizing InSAR data I’ve ever seen comes from the ESA. Their great video illustrates how the East African Rift is in motion. Amazing!
Unfortunately, I can not embed the video here, but these two video also nicely show how it works:
Truly digital geography.
References:
- De Natale, G., Crippa, B., Troise, C. & Pingue, F. 2011. Abruzzo, Italy, Earthquakes of April 2009: Heterogeneous Fault-Slip Models and Stress Transfer from Accurate Inversion of ENVISAT-InSAR Data. Bulletin of the Seismological Society of America, 101 (5), 2340–2354, doi: 10.1785/0120100220.


