If you are reading this post – you might know something about satellite imagery. This is a valuable source to power quite a lot of analytics and monitoring applications. In this post I’d like to give you an idea of how all this Big Data stuff can be obtained and processed online, using the single API called #VANE language.
What is VANE?
The VANE geospatial platform, that’s coming out of the Beta now, is a new project we started at Openweathermap, relying on our expertise in providing well-designed APIs for weather data which is widely used by devs community. The VANE concept is to unite all operations with remote sensing data into consistent queries, allowing users to work with the data similar to the other SQL-fashioned APIs, they are probably familiar with. This approach is different from what the typical workflow of Earth observation data usually is. Typicaly one needs to search for the certain imagery or dataset through the catalog, then place an order, then download it from FTP and process it in some desktop software he knows how to deal with, etc. That’s why the cloud-based data processing workflows are developing very fast towards providing users with most capabilities online.
So what do we get with “VANE language” API and how it works?
- You can SELECT by time, source, date-time period, imagery bands, tile coordinates and many other parameters, specifying the appropriate one.
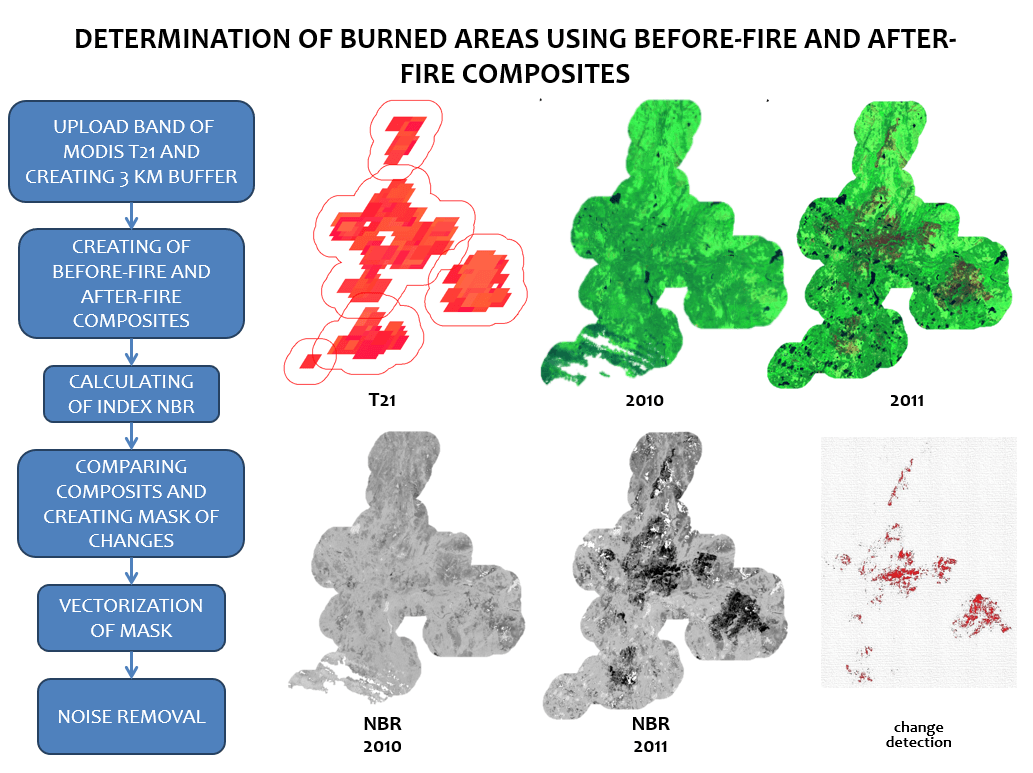
- You can APPLY online processing with multispectral 16-bit imagery, like difference indices, Change Detection, custom color processing…
- And finally, you GET the result instantly as tiles or GeoJSON-polygon.
This is the architecture concept at its prime and it couldn’t be easier to cover 99% of developers needs regarding this kind of geospatial data.
Data Selection in Vane
Let’s have a look at the example of a template query for #MODIS imagery:
http://{s}.sat.owm.io/sql/{z}/{x}/{y}?select=b1,b4,b3&from=modis&order=last&color=modis&APPID={APIKEY}
Based on this template URL we get the most recent MODIS imagery in RGB True color processing mode.
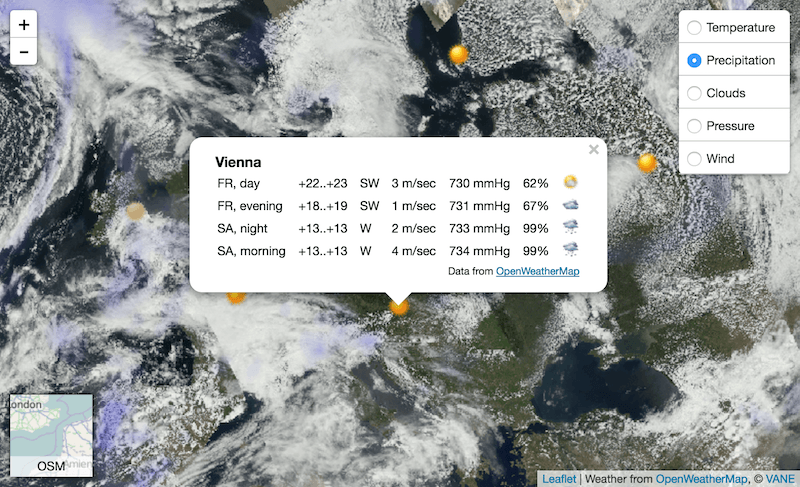
This kind of imagery enables Earth observation on a daily time basis and can be vividly combined with weather map layers. The delay between satellite overpasses and publication of the imagery in VANE platform is less than one hour. Every 30 minutes new imagery comes from each of Terra and Aqua satellites. That makes about three paths ahead comparing to popular NASA Worldview in “Web Mercator” projection. So we can build some nice looking application combining the current Precipitation or Temperature and the real look of the Earth from satellite (click MODIS button in the left bottom corner).
One More Thing
I hope that this very basic introduction into the approach of how to work with satellite and weather data through extendable API is enough for now to make you interested in experimenting with your own projects and diving deeper into applied areas.
And I’m going to continue sharing the information about environmental data and the way to use it for web and GIS applications. If you are interested in giving me some feedback in advance – just shoot me a message.
Links to the useful sources I’ve mentioned above:
You can also join our next webinar.