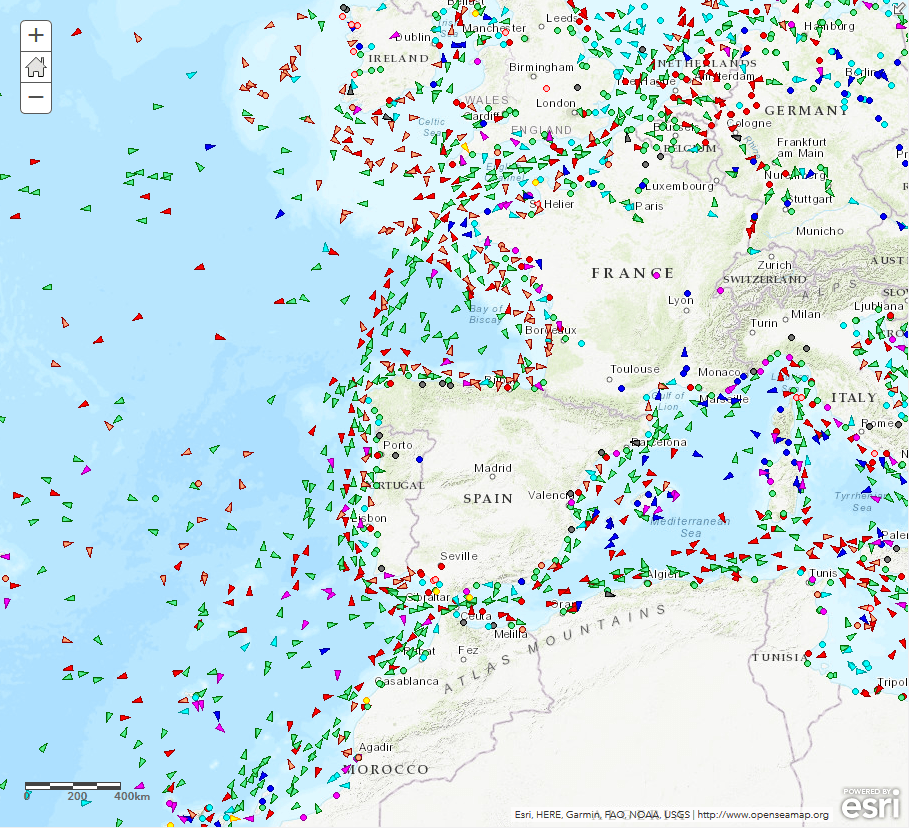
Let’s assume you like cruise ships, tanker, ferries or you’re so fortunate and own a fleet of vessels cruising over the oceans. But where the heck are the ones you’re interested in. First you can visit MarineTraffic and search for the Vessels you’re interested in. But what if you want to keep track of those vessels or if you want to put them on your “own” map. Now Python comes in handy and I’ll show you how to gather coordinates and put them on a map using the ArcGIS API for Python.
The used “Plattform”
For this task I am using a jupyter notebook as part of the ArcGIS API for Python. But the main steps can be done without the Esri part. We will grab all the data from a website called vesselfinder.com.
The Process of getting Vessel Data
First of all, we will need some modules for getting the web data and parsing it. Furthermore we will need some Pandas magic to prepare the data for the map:
#module import
import urllib.request
from bs4 import BeautifulSoup
import re
import pandas as pd
from datetime import datetime
import locale
locale.setlocale(locale.LC_ALL, 'en_US') #as we need to deal with names of monthes later on.
import os
As we do have all dependencies now, we will need some input for our workflow. Therefore I’Ve prepared a list of so-called IMO numbers of ships I would like to track. If you don’t know the IMO number of the ship of your choice… balticshipping might help.
As we do have everything set up, we will now make webcalls to the vesselfinder website and grab the details from the page (code from the webpage changed, so I updated the code snippet:
hdr = {'User-Agent': 'Mozilla/5.0 (X11; Linux x86_64) AppleWebKit/537.11 (KHTML, like Gecko) Chrome/23.0.1271.64 Safari/537.11',
       'Accept': 'text/html,application/xhtml+xml,application/xml;q=0.9,*/*;q=0.8',
       'Accept-Charset': 'ISO-8859-1,utf-8;q=0.7,*;q=0.3',
       'Accept-Encoding': 'none',
       'Accept-Language': 'en-US,en;q=0.8',
       'Connection': 'keep-alive'}
items = []
for IMO in IMOS:
    url = r'https://www.vesselfinder.com/en/vessels/VOS-TRAVELLER-IMO-' + str(IMO)
    req = urllib.request.Request(url, None, hdr)
    with urllib.request.urlopen(req) as response:
        the_page = response.read()
    parsed_html = BeautifulSoup(the_page)
    tables = parsed_html.findAll("table")
    for table in tables:
        if table.findParent("table") is None:
            for row in table.findAll('tr'):
                aux = row.findAll('td')

                try:
                    if aux[0].string == "Coordinates":
                        coords = aux[1].string
                    if aux[0].string == "Vessel Name":
                        name = aux[1].string
                    if aux[0].string == "Position received":
                        print(aux[1].get("data-title"))
                        zeit = datetime.strptime(aux[1].get("data-title"), '%b %d, %Y %H:%M %Z')
                        print(zeit)
                except:
                    print("strange table found")
    coordsSplit = coords.split("/")
    def dms2dd(degrees,direction):
        dd = float(degrees) ;
        if direction == 'S' or direction == 'W':
            dd *= -1
        return dd
    def parse_dms(dms):
        parts = re.split(' ', dms)
        lat = dms2dd(parts[0], parts[1])
        return lat
    lat = parse_dms(coordsSplit[0])
    lng = parse_dms(coordsSplit[1])
    items.append((lat, lng, name, zeit))
To keep track of our vessels we will store the found coordinates inside a simple textfile:
filename = 'ship_positions.txt'
if os.path.exists(filename):
    append_write = 'a' # append if already exists
    fw = open(filename,append_write)
else:
    append_write = 'w' # make a new file if not
    fw = open(filename,append_write)
    fw.write("lat;lng;name;time\n")
for item in items:
    fw.write("%3.5f;%3.5f;%s;%s\n" % item)
fw.close()
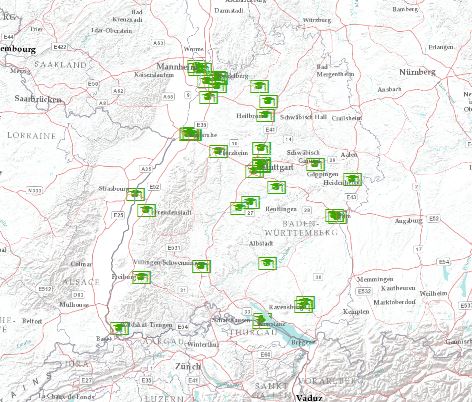
This will create a textfile with timestamps of ships and the associated coordinates
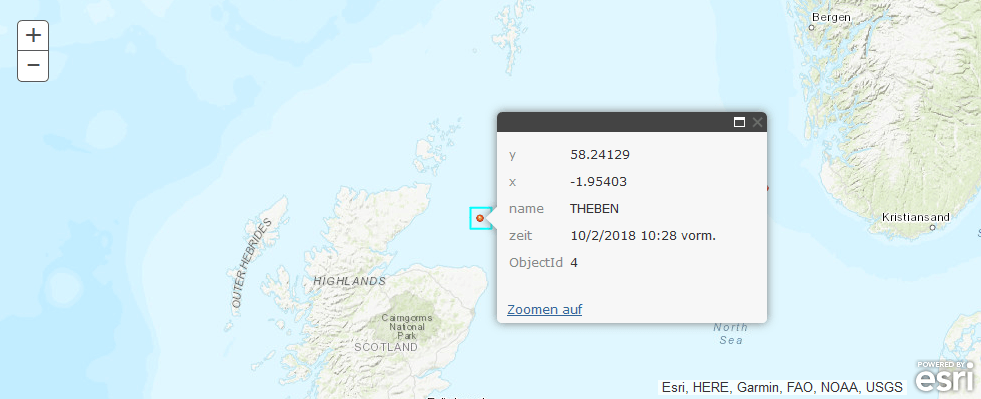
Putting it on a Map
As we have the coordinates in an array we can create a dataframe from those items and put them on a map:
#get it on a map:
from arcgis.gis import GIS
gis = GIS()
map = gis.map()
df = pd.DataFrame.from_records(items)
df.columns = ['y', 'x', 'name', 'zeit']
ships = gis.content.import_data(df)
map.add_layer(ships)
map.center = [lat, lng]
map
The tracking of your ship has been made easy with the marine traffic. The details here about vessel schedule and its tracking is helpful.
Shengda
4 years ago
Thank you Riccardo! This is exactly what I wish to do with Python. A small question here is that there is an error on my end when scrapping from vesselfinder. It seems we cannot locate the “Last report” information and define the “zeit” variable. One possible reason could be that there is a small wifi logo following the “Last report” (see https://www.vesselfinder.com/vessels/DELTA-VICTORY-IMO-9288708-MMSI-240290000). Can you please advise to help? Thanks.
Hi Shengda, the website changed its structure so you need to update the code. : hdr = {‘User-Agent’: ‘Mozilla/5.0 (X11; Linux x86_64) AppleWebKit/537.11 (KHTML, like Gecko) Chrome/23.0.1271.64 Safari/537.11’, ‘Accept’: ‘text/html,application/xhtml+xml,application/xml;q=0.9,*/*;q=0.8’, ‘Accept-Charset’: ‘ISO-8859-1,utf-8;q=0.7,*;q=0.3’, ‘Accept-Encoding’: ‘none’, ‘Accept-Language’: ‘en-US,en;q=0.8’, ‘Connection’: ‘keep-alive’} items = [] for IMO in IMOS: url = r’https://www.vesselfinder.com/en/vessels/VOS-TRAVELLER-IMO-‘ + str(IMO) req = urllib.request.Request(url, None, hdr) with urllib.request.urlopen(req) as response: the_page = response.read() parsed_html = BeautifulSoup(the_page) tables = parsed_html.findAll(“table”) for table in tables: if table.findParent(“table”) is None: for row in table.findAll(‘tr’): aux = row.findAll(‘td’) try: if aux[0].string == “Coordinates”: coords = aux[1].string if aux[0].string == “Vessel Name”: name = aux[1].string if… Read more »
Your input is very interesting. I have seen the json and not all vessel appear. How can you access more information or other json files that contain it?
Your input is very interesting. I have seen the json and not all vessel appear. How can you access more information or other json files that contain it?
Lucas
3 years ago
Hi. I´m doing a Power BI project where I need to plot in a map the position of a few ships in a fleet. Your code is exactly what I was looking for. Awesome job writing this code! It will be very useful for my project, but unfortunately I was unable to make it work. The ‘coords’ variable is not being created and generates an error, maybe there was a change in the VesselFinder website. I tried some changes on the code but still couldn´t make it work. Do you know how to update it with this new version of… Read more »
Raj
3 years ago
I was trying to get execute your code but got strange table instead. How to overcome it? Thank you.
Ger Smit
3 years ago
Dear Riccardo,
My name is Ger from Holland.
I use your program and is working almost.
Can you help me to solve some problems?
1 – It is not possible to convert the time with :zeit = datetime.strptime(aux[1].get("data-title"), '%b %d, %Y %H:%M %Z').
Can you tell me what i doing wrong in Pytyhon3?
2 How solve the problem with the lxml?
To get rid of this warning, pass the additional argument ‘features=”lxml”‘ to the BeautifulSoup constructor.
Thanks in advance for an answer and greetings
Ger
Ger Smit
3 years ago
Hi Riccardo,
The problem with the time is probably the error that give:
Traceback (most recent call last):
File “/home/pi/vessel_python/vessel_data_python.py”, line 45, in <module>
if aux[0].string == “Position received”:
IndexError: list index out of range
This error is coverted by try — exept.
Can you tell me how to solve this error?
This week it is all about topology, proximity and combining logical and spatial queries at ESRI’s MOOC. Furthermore you will get to know path analysis and what are…
Today I stumbled upon a post from the German ESRI office and their blog gisIQ and a little tutorial (English translation) on how to geocode addresses in the…
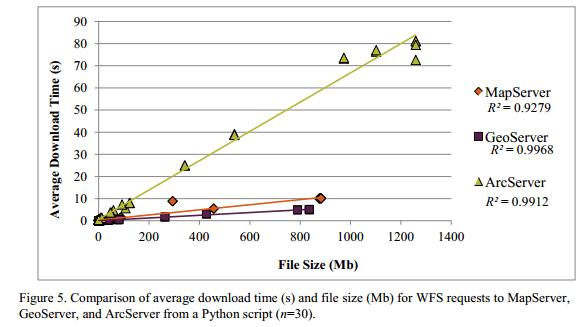
originally posted from our friends @mappinggis Which program is better suited to serve geographic data on the web? ArcGIS Server form ESRI or open source ? This question is common in mailing lists…


The tracking of your ship has been made easy with the marine traffic. The details here about vessel schedule and its tracking is helpful.
Thank you Riccardo! This is exactly what I wish to do with Python. A small question here is that there is an error on my end when scrapping from vesselfinder. It seems we cannot locate the “Last report” information and define the “zeit” variable. One possible reason could be that there is a small wifi logo following the “Last report” (see https://www.vesselfinder.com/vessels/DELTA-VICTORY-IMO-9288708-MMSI-240290000). Can you please advise to help? Thanks.
Hi Shengda, the website changed its structure so you need to update the code. : hdr = {‘User-Agent’: ‘Mozilla/5.0 (X11; Linux x86_64) AppleWebKit/537.11 (KHTML, like Gecko) Chrome/23.0.1271.64 Safari/537.11’, ‘Accept’: ‘text/html,application/xhtml+xml,application/xml;q=0.9,*/*;q=0.8’, ‘Accept-Charset’: ‘ISO-8859-1,utf-8;q=0.7,*;q=0.3’, ‘Accept-Encoding’: ‘none’, ‘Accept-Language’: ‘en-US,en;q=0.8’, ‘Connection’: ‘keep-alive’} items = [] for IMO in IMOS: url = r’https://www.vesselfinder.com/en/vessels/VOS-TRAVELLER-IMO-‘ + str(IMO) req = urllib.request.Request(url, None, hdr) with urllib.request.urlopen(req) as response: the_page = response.read() parsed_html = BeautifulSoup(the_page) tables = parsed_html.findAll(“table”) for table in tables: if table.findParent(“table”) is None: for row in table.findAll(‘tr’): aux = row.findAll(‘td’) try: if aux[0].string == “Coordinates”: coords = aux[1].string if aux[0].string == “Vessel Name”: name = aux[1].string if… Read more »
Hi Riccardo, great tutorial, thanks.
I was wondering if you could give me hint how to get using python, the json data loaded with https://www.marinetraffic.com/en/ais/home/centerx:124.6/centery:22.9/zoom:2
The json is https://www.marinetraffic.com/getData/get_data_json_4/z:2/X:1/Y:0/station:0
Which gives the data of vessels :
{“type”:1,”data”:{“rows”:[{“LAT”:”20.58006″,”LON”:”70.22562″,”SPEED”:”193″,”COURSE”:”284″,”HEADING”:”285″,”ELAPSED”:”1″,”DESTINATION”:”MUNDRA”,”FLAG”:”LR”,”LENGTH”:”336″,”ROT”:”0″,”SHIPNAME”:”MSC LISBON”,”SHIPTYPE”:”7″,”SHIP_ID”:”757781″,”WIDTH”:”45″,”L_FORE”:”261″,”W_LEFT”:”20″,”DWT”:”110697″,”GT_SHIPTYPE”:”11″},{“LAT”:”53.40211″,”LON”:”-4.131983″,”SPEED”:”1″,”COURSE”:”45″,”HEADING”:”294″,”ELAPSED”:”2″,”DESTINATION”:”GB TRA”,”FLAG”:”LR”,”LENGTH”:”243″,”ROT”:”0″,”SHIPNAME”:”ANGELICA SCHULTE”,”SHIPTYPE”:”8″,”SHIP_ID”:”757416″,”WIDTH”:”42″,”L_FORE”:”204″,”W_LEFT”:”20″,”DWT”:”106433″,”GT_SHIPTYPE”:”17″},{“LAT”:”42.04916″,”LON”:”11.50321″,”SPEED”:”64″,”COURSE”:”335″,”HEADING”:”342″,”ELAPSED”:”1″,”DESTINATION”:”ITGIT>ITCVV”,”FLAG”:”HK”,”LENGTH”:”299″,”ROT”:”28″,”SHIPNAME”:”MSC ALGECIRAS”,”SHIPTYPE”:”7″,”SHIP_ID”:”685186″,”WIDTH”:”48″,”L_FORE”:”110″,”W_LEFT”:”16″,”DWT”:”111000″,”GT_SHIPTYPE”:”11″},{“LAT”:”53.62904″,”LON”:”5.279595″,”SPEED”:”62″,”COURSE”:”252″,”HEADING”:”251″,”ELAPSED”:”1″,”DESTINATION”:”DEWVN>NLRTM”,”FLAG”:”HK”,”LENGTH”:”399″,”ROT”:”0″,”SHIPNAME”:”OOCL INDONESIA”,”SHIPTYPE”:”7″,”SHIP_ID”:”5337678″,”WIDTH”:”58″,”L_FORE”:”145″,”W_LEFT”:”23″,”DWT”:”191374″,”GT_SHIPTYPE”:”11″},{“LAT”:”36.67769″,”LON”:”22.06544″,”SPEED”:”15″,”COURSE”:”7″,”HEADING”:”86″,”ELAPSED”:”2″,”DESTINATION”:”OPL KALAMATA”,”FLAG”:”MH”,”LENGTH”:”274″,”ROT”:”0″,”SHIPNAME”:”CAPE BALDER”,”SHIPTYPE”:”8″,”SHIP_ID”:”714780″,”WIDTH”:”48″,”L_FORE”:”230″,”W_LEFT”:”24″,”DWT”:”159998″,”GT_SHIPTYPE”:”71″},{“LAT”:”42.49949″,”LON”:”27.53619″,”SPEED”:”1″,”COURSE”:”346″,”HEADING”:”208″,”ELAPSED”:”2″,”DESTINATION”:”FOR ORDERS”,”FLAG”:”MH”,”LENGTH”:”199″,”ROT”:”0″,”SHIPNAME”:”FEDERAL RUHR”,”SHIPTYPE”:”7″,”SHIP_ID”:”4757488″,”WIDTH”:”23″,”L_FORE”:”170″,”W_LEFT”:”9″,”DWT”:”36500″,”GT_SHIPTYPE”:”9″},{“LAT”:”38.21161″,”LON”:”15.26949″,”SPEED”:”0″,”COURSE”:”264″,”HEADING”:”11″,”ELAPSED”:”2″,”DESTINATION”:”MILAZZO,ITALY”,”FLAG”:”LR”,”LENGTH”:”274″,”ROT”:”0″,”SHIPNAME”:”GIANNIS”,”SHIPTYPE”:”8″,”SHIP_ID”:”754788″,”WIDTH”:”50″,”L_FORE”:”232″,”W_LEFT”:”34″,”DWT”:”149999″,”GT_SHIPTYPE”:”14″},{“LAT”:”21.56791″,”LON”:”108.3331″,”SPEED”:”45″,”COURSE”:”344″,”HEADING”:”350″,”ELAPSED”:”3″,”DESTINATION”:”CN FAN”,”FLAG”:”HK”,”LENGTH”:”254″,”ROT”:”1″,”SHIPNAME”:”MAGSENGER 19″,”SHIPTYPE”:”7″,”SHIP_ID”:”688546″,”WIDTH”:”43″,”L_FORE”:”218″,”W_LEFT”:”16″,”DWT”:”115396″,”GT_SHIPTYPE”:”6″},{“LAT”:”59.62011″,”LON”:”23.76777″,”SPEED”:”114″,”COURSE”:”69″,”HEADING”:”72″,”ELAPSED”:”1″,”DESTINATION”:”PRIMORSK”,”FLAG”:”LR”,”LENGTH”:”250″,”ROT”:”0″,”SHIPNAME”:”KALAHARI”,”SHIPTYPE”:”8″,”SHIP_ID”:”144314″,”WIDTH”:”43″,”L_FORE”:”208″,”W_LEFT”:”22″,”DWT”:”112827″,”GT_SHIPTYPE”:”71″},
and what is your question? What sort of help is needed?
Just iterate and pull out the ship ID’s, then use other MT functions to get the other data you require. I did this recently.
hi cuperto,
Your input is very interesting. I have seen the json and not all vessel appear. How can you access more information or other json files that contain it?
Your input is very interesting. I have seen the json and not all vessel appear. How can you access more information or other json files that contain it?
Hi. I´m doing a Power BI project where I need to plot in a map the position of a few ships in a fleet. Your code is exactly what I was looking for. Awesome job writing this code! It will be very useful for my project, but unfortunately I was unable to make it work. The ‘coords’ variable is not being created and generates an error, maybe there was a change in the VesselFinder website. I tried some changes on the code but still couldn´t make it work. Do you know how to update it with this new version of… Read more »
I was trying to get execute your code but got strange table instead. How to overcome it? Thank you.
Dear Riccardo,
My name is Ger from Holland.
I use your program and is working almost.
Can you help me to solve some problems?
1 – It is not possible to convert the time with :
zeit = datetime.strptime(aux[1].get("data-title"), '%b %d, %Y %H:%M %Z').Can you tell me what i doing wrong in Pytyhon3?
2 How solve the problem with the lxml?
To get rid of this warning, pass the additional argument ‘features=”lxml”‘ to the BeautifulSoup constructor.
Thanks in advance for an answer and greetings
Ger
Hi Riccardo,
The problem with the time is probably the error that give:
Traceback (most recent call last):
File “/home/pi/vessel_python/vessel_data_python.py”, line 45, in <module>
if aux[0].string == “Position received”:
IndexError: list index out of range
This error is coverted by try — exept.
Can you tell me how to solve this error?
Thanks and greetings
Ger