In this article we consider the use OpenWebGIS, as one of the free Web GISs for analyzing of buildings drawings, as well as mapping and measurement of small-scale objects that are demanded in archeology, architecture, biology, medicine and other fields of human activity.
Tell me, how many online Web GISs can use the maximum zooming ratio of more than 19? Those Web GISs which use OpenStreetMap as a base map, generally have a maximum zoom to 19. Those Web GISs which use Google Maps as a base map, can increase to no more than 19-20, but in some cases this range depends on where you are looking at. Some places only have zoom levels of 15, where as other places have 23 (or possibly more).
There are situations when the user needs or simply is interested in applying on the building plan on the geographic map in the form of a vector layer. It is also often necessary to overlay the scanned image or photo of the drawing, like an old plan and analyze them. If it will be possible to make the successfully georeferenced drawing, then with the help of GIS you can measure the length or area of small-scale objects, the size of which is not specified in the plan or was not previously known. It is desirable to colorfully highlight the objects of interest and select the color and thickness of lines, depending on their length or importance.
OpenWebGIS allows you to make all of mentioned above online. To do this, either use “Political map” as a base layer (it is presented by default on the left in the list of base layers), or upload any your own base layer (it should be pre-loaded on the server OpenWebGIS – it can be made by any user after login). Please do not forget that non-basic layers to the map, but not on the server, can be added by a user without authorization. The maximum zoom ratio of base layers in OpenWebGIS is 32 and it can theoretically be greater if users wish.
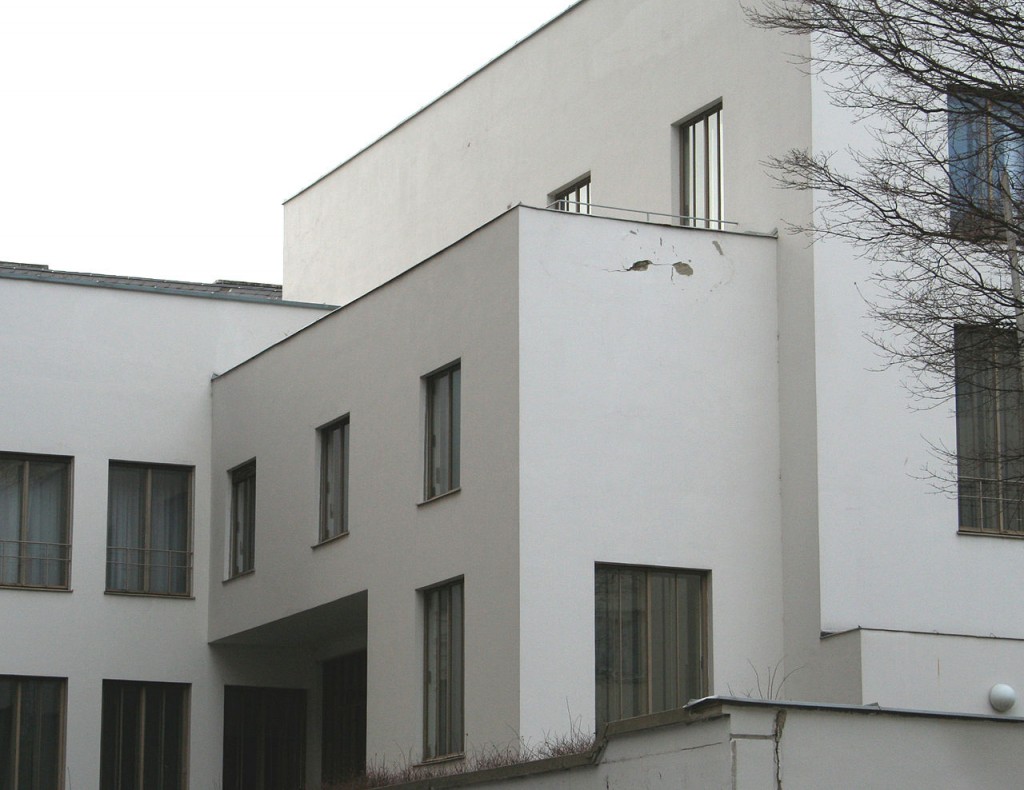
Consider how to view and measure small objects on the example of the building drawing of Haus Wittgenstein, (also known as the Stonborough House and the Wittgenstein House) is a house in the modernist style designed and built on the Kundmanngasse, Vienna, by the Austrian architect Paul Engelmann and the Austrian philosopher Ludwig Wittgenstein. The building was built in 1928
Haus Wittgenstein (photo from Wikipedia)
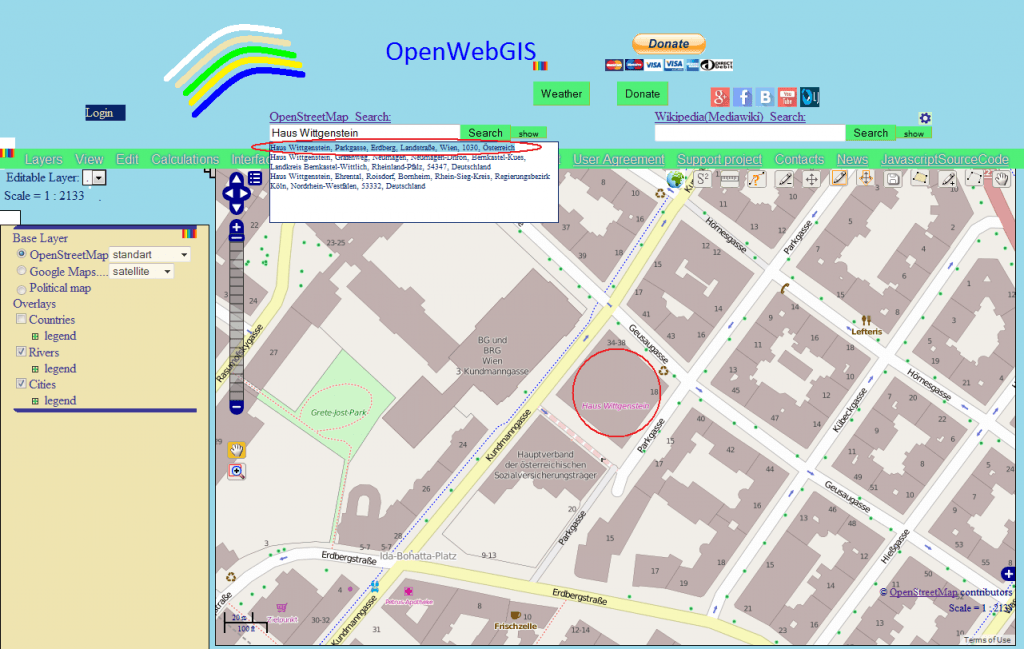
Let’s look at this building using the maximum zoom of OpenStreetMap. To do this in the search bar “OpenStreetMap_Search” type the name of Haus Wittgenstein (without the quotes) and press the button “Search”. We will get a list of objects found. Click on the first string “Haus Wittgenstein, Parkgasse, Erdberg, Landstraße, Wien, 1030, Österreich” and immediately the map will be positioned on interesting building with a maximum zoom. The result is shown in the screenshot below. To remove the list of found objects, press “show”.
House Wittgenstein on the OpenStreetMap
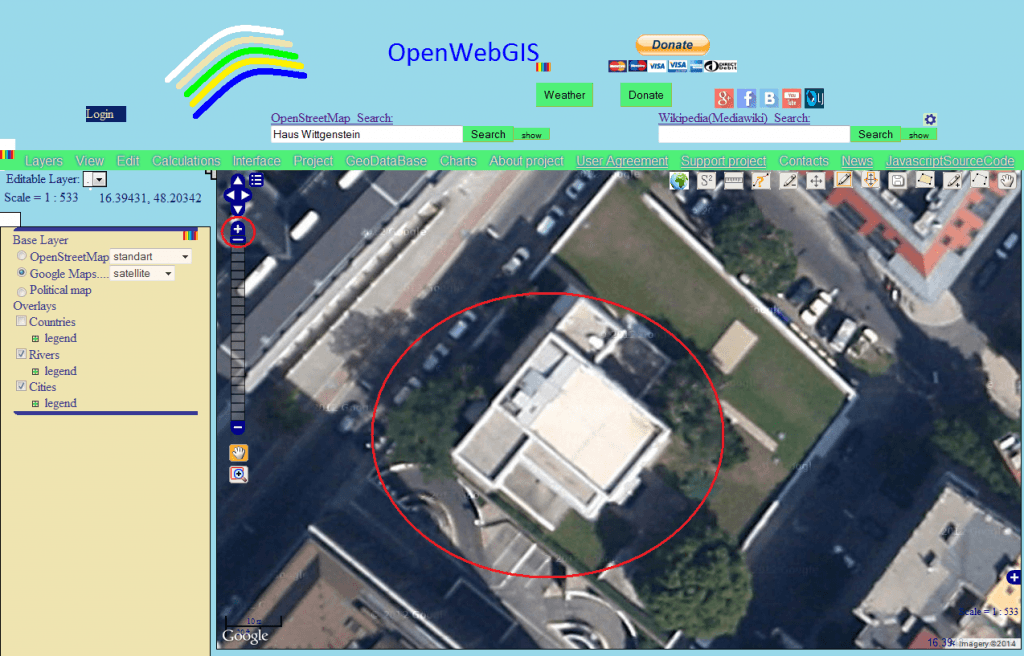
Then switch the base layer on Google Maps and see that we have the ability to zoom the building scale (map) a little more.
House Wittgenstein on the Google MapsMaximum zoom of House Wittgenstein on the Google Maps
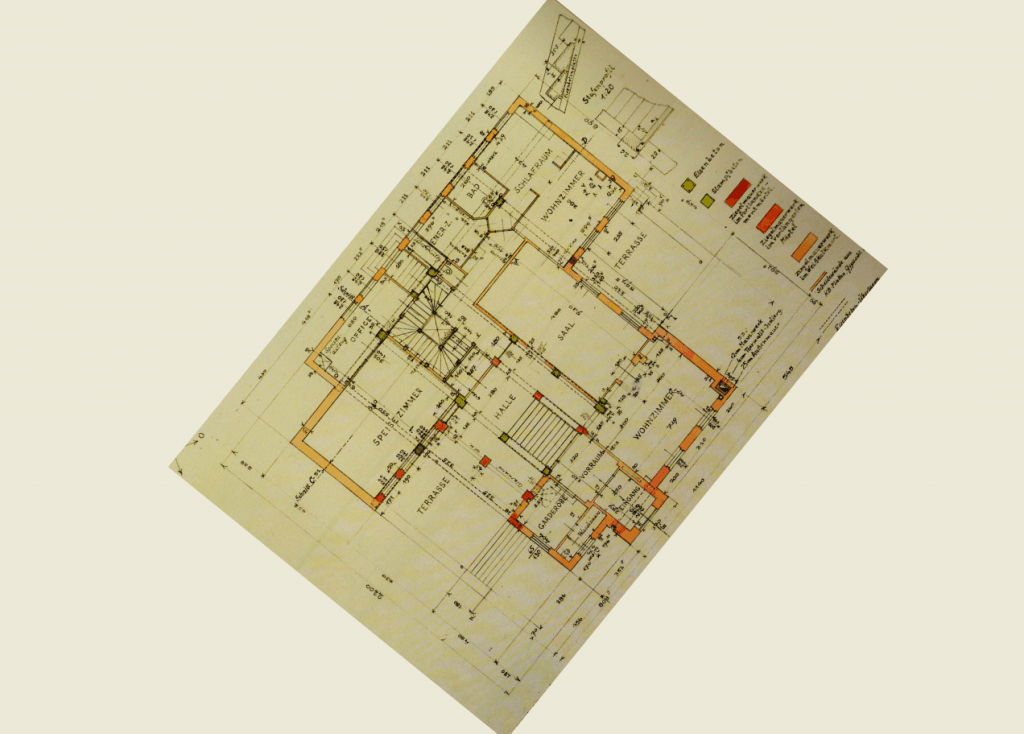
Now let’s suppose that we want to bind the old plan of the building to the resulting map. In this case it is necessary to find a drawing of the building on which there is the maximum number of sizes. This is necessary in this case to verify the correctness and adequacy of the drawing binding to the map in OpenWebGIS. In other cases, this function is needed to learn unknown dimensions of the drawing we are interested in online. I found a great article about Haus Wittgenstein.
Take a detailed plan: Construction plan, November 1926, signed by Engelmann and Wittgenstein. Courtesy of Baupolizei, Rathaus Wien.
Construction plan of House Wittgenstein, November 1926, signed by Engelmann and Wittgenstein. Courtesy of Baupolizei, Rathaus Wien. From http://www.metalocus.es
Pay attention to the important point, which is that the building on the map is rotated by about 51 degrees relatively to the horizontal axe, and our plan does not have such inclination. Therefore, to bind a drawing of the building correctly, we will have to do a preparatory work offline, – namely, a rotation of the drawing in any editor of images to the horizontal axis at 51 degrees. Do not be upset because of that – soon the same will be possible to do directly in OpenWebGIS.
Rotate the drawing of Haus Wittgenstein about the axis and store it on our hard drive. The result can be seen in the picture below:
Rotated drawing of House Wittgenstein
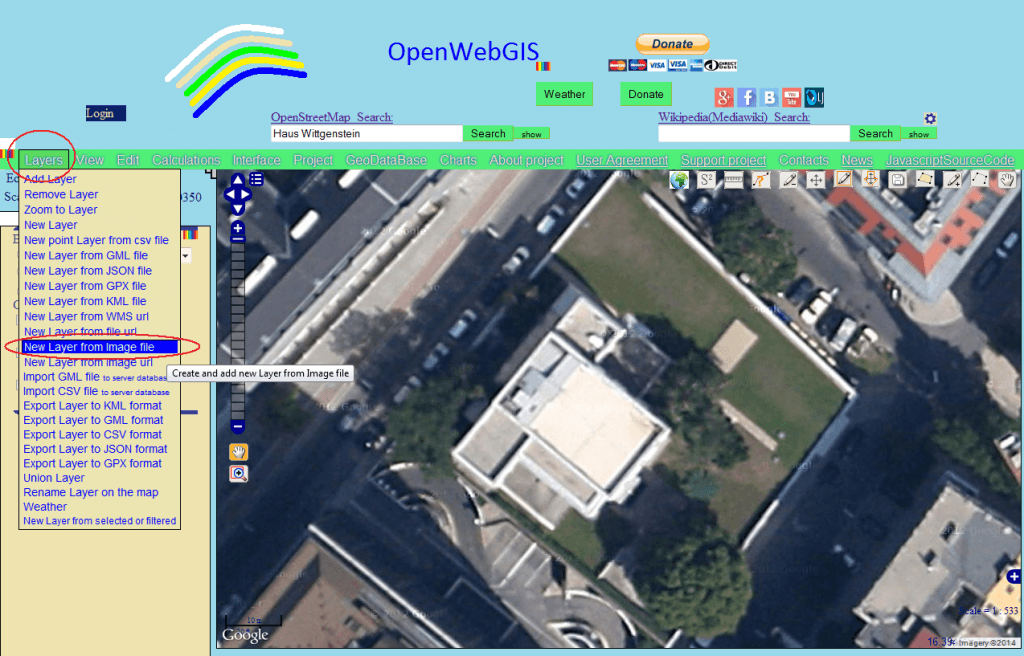
Next we need to add the resulting image of the building drawing on the map. To do this, select the menu item “Layers-> New Layer from Image file”.
Menu item “Layers-> New Layer from Image file” in the interface of OpenWebGIS.
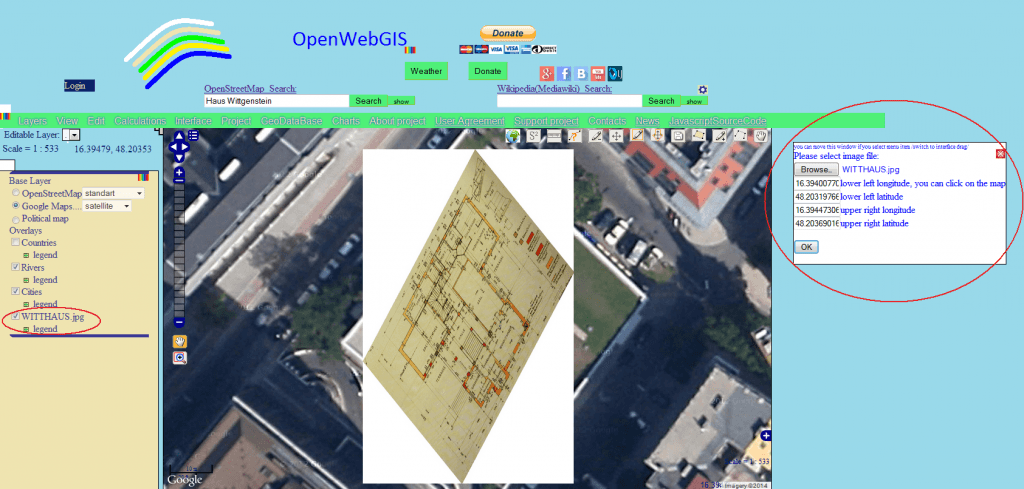
For binding a drawing you need using the “Browse” button in the popup window that appears to select an image file, storing on your disk, then insert the geographic coordinates of the lower left corner and upper right corner. This can be done either manually with the keyboard, or, that in my opinion is much more convenient by two clicks on the map (of course, it will not be exact, but then you can always adjust the coordinates). After the first click the coordinates of the lower left corner will be filled automatically, after the second one the same will be true about the upper right. In order to re-insert the coordinates using the clicks, it is enough to clear the fields of lower left longitude and upper right longitude.
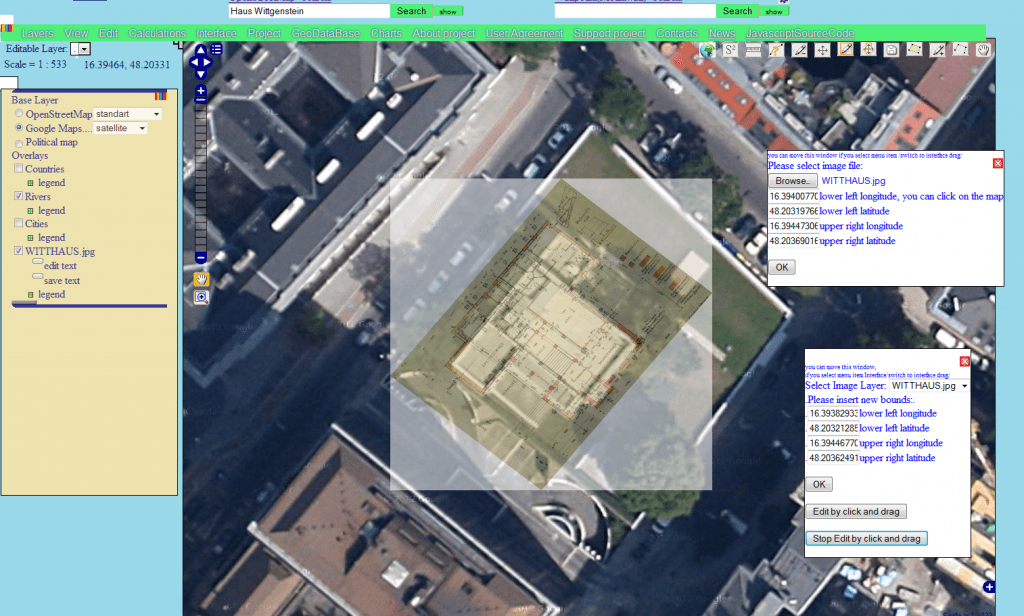
The result of the preliminary drawing overlay on the map we can see in the picture below.
The result of the preliminary drawing overlay on the map
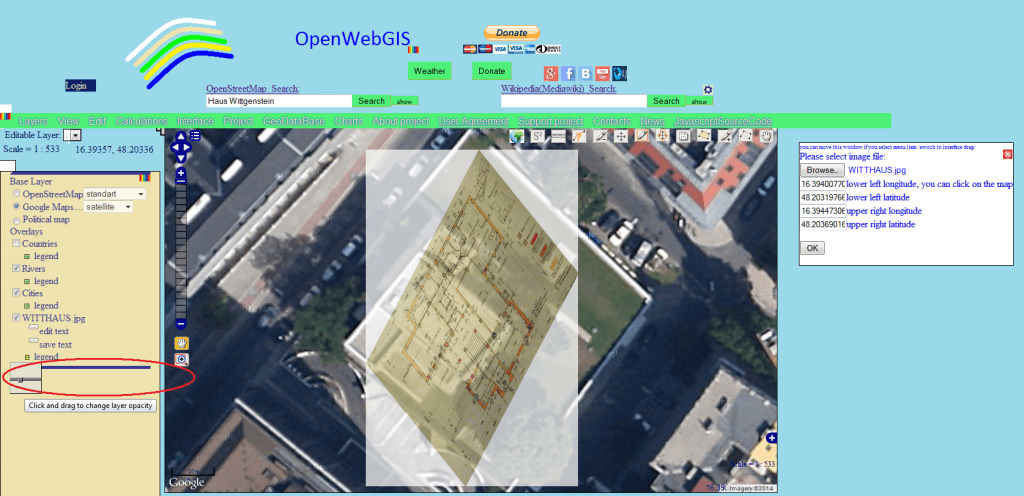
To make overlay inaccuracy seen, let’s change the picture transparency using the button under the word “legend”, under the layer name “WITHAUS.jpg”.
The result of the preliminary drawing overlay on the map after its transparency changing
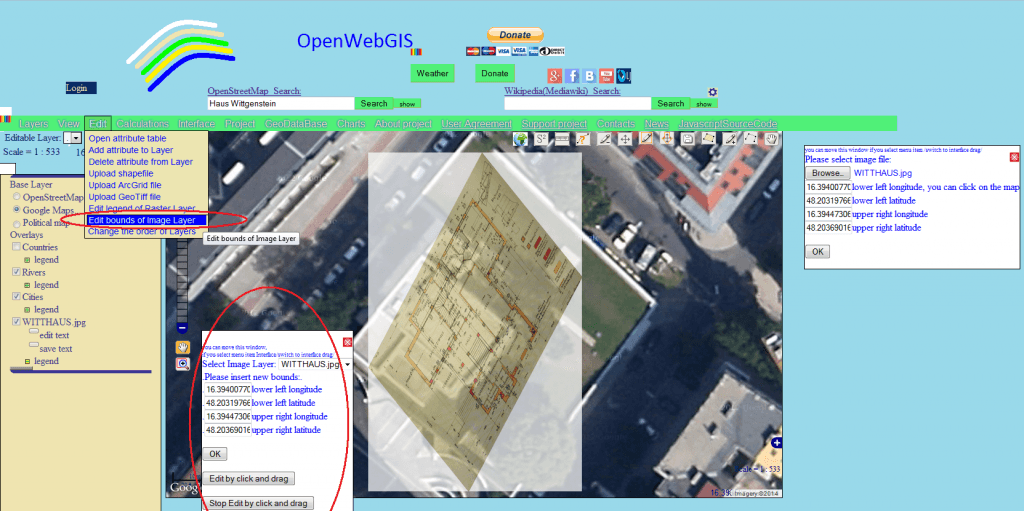
To overlay more precisely, we use a special feature available in the menu item “Edit-> Edit bounds of Image Layer”.
Menu item “Edit-> Edit bounds of Image Layer” in the interface of OpenWebGIS.
The following describes the process of accurate drawing binding the to map with the help of this function.
In OpenWebGIS the editing function of the image layer bounds (borders) has been redesigned. Image layer is generated by adding images (format jpg, png, etc.) on the map. This function with transparency changing of the image and other layers can have many practical applications, such as for historians – the overlay of old maps of the area to modern ones for analysis of the terrain changes, for treasure hunters – identifying of locations with potentially interesting search opportunities for intact artifacts in abandoned settlements (non-existent on modern maps).
Similar functions of course already exist in other software, but the main advantage of OpenWebGIS, is that this and other functions can be used online without downloading and installing on your PC any additional software.
Now the window with editing settings of the image layer bounds can be (after selecting the menu item “Interface->Switch to interface drag”) moved at any convenient for the user place on the screen.
The user can overlay the image on the map in two ways:
Changing the appropriate editbox (input fields) of geographical coordinates of the lower left corner and upper right corner
Dragging the picture after clicking on it and stretching the edges of the picture (this happens after you click “Edit by click and drag’)
If the first method is basically clear, the second one has the features you need to know to use the functions effectively. After pressing the ‘Edit by click and drag’ button to drag the image to any location on the map you must click (left mouse button) once on the appropriate image, then following the moving cursor the image will move, after moving it to the desired place click again and the movement will be over. To change the image bounds (expansion and contraction) you need to move the mouse cursor to the image edge. After that the cursor form will change and you can start moving it. If the cursor is near the right edge, depending on the cursor movement direction the image will either decrease or increase in the width. If the cursor is near the bottom edge, depending on the cursor movement direction the image will either decrease or increase in the height. If the cursor is to the left side, the picture will only increase in the width to the right, if the cursor is near the top edge, the picture will only increase downwards in the height. In all mentioned cases during the cursor movement the coordinates values automatically change in the editboxes. These coordinates values correspond to the current position and size of the image.
Important: To use this function, all vector layers lying above the image layer, must be disabled (invisible), i.e. ticked off in front of them in the list of map layers.
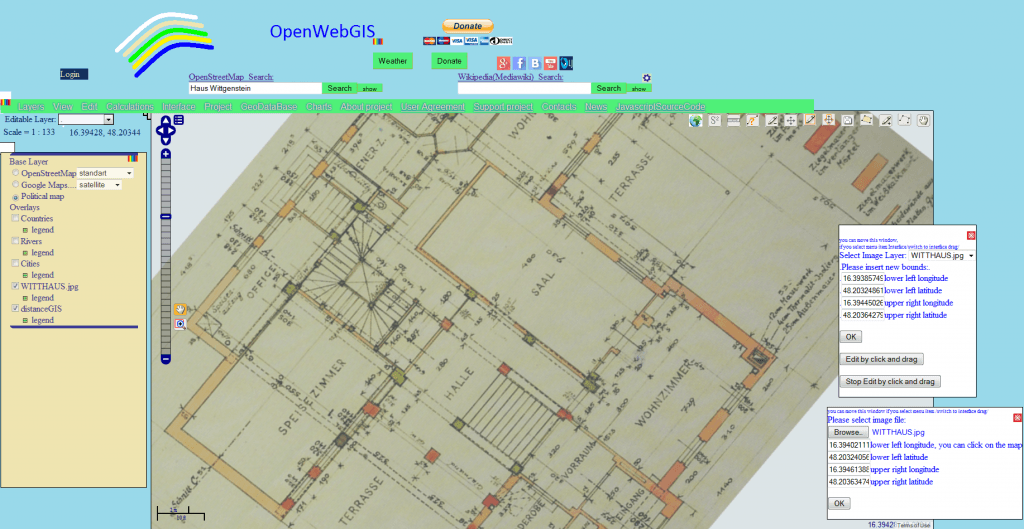
The result of the building drawing binding to a geographical map
Now, to examine the drawing in detail, it is necessary to switch on the base layer provided by OpenWebGIS, in this case, let’s switch to “Political map” layer and increase it.
Drawing in detail on the map of OpenWebGIS
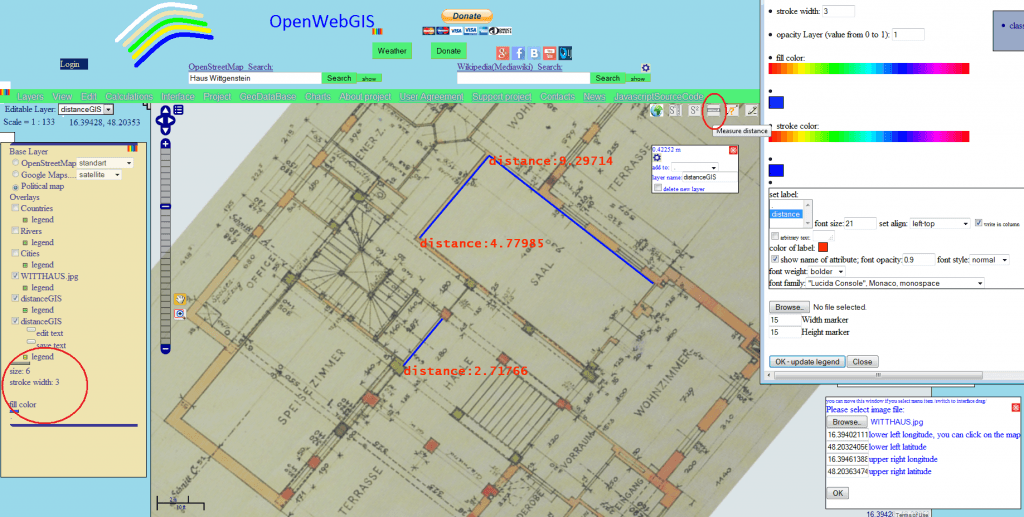
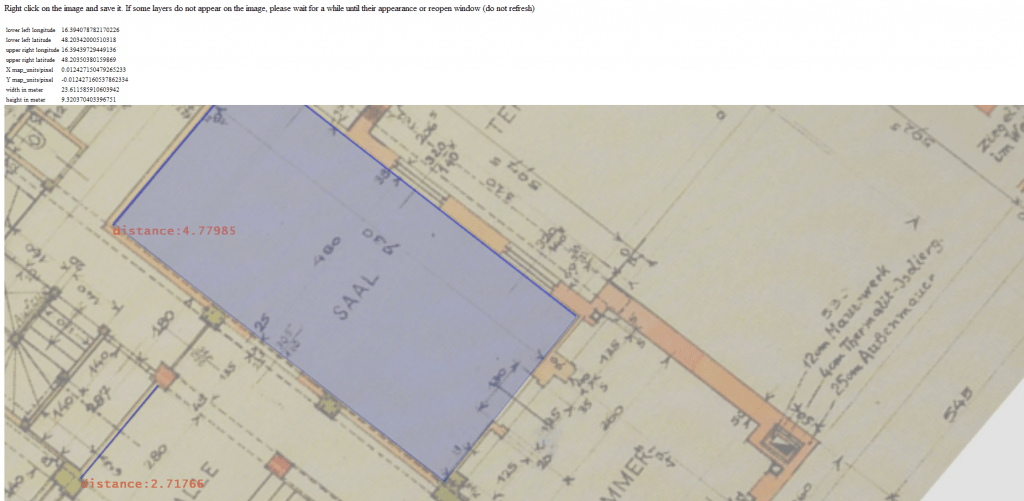
Using the button “Measure distance” let’s measure for example the lengths of three walls. While doing so the lines with the “distance” attribute are added to the vector layer “distanceGIS”. Change the legend of the layer ( increase the thickness of measuring lines, color them blue and write the length in red letters), so you need to click on the area under the word “legend” and under the layer name.
Putting dimension lines on the drawingDrawing on the map of OpenWebGIS with legend settings of vector layers with dimensionsDrawing on the map of OpenWebGIS with legend settings of vector layers with dimensions
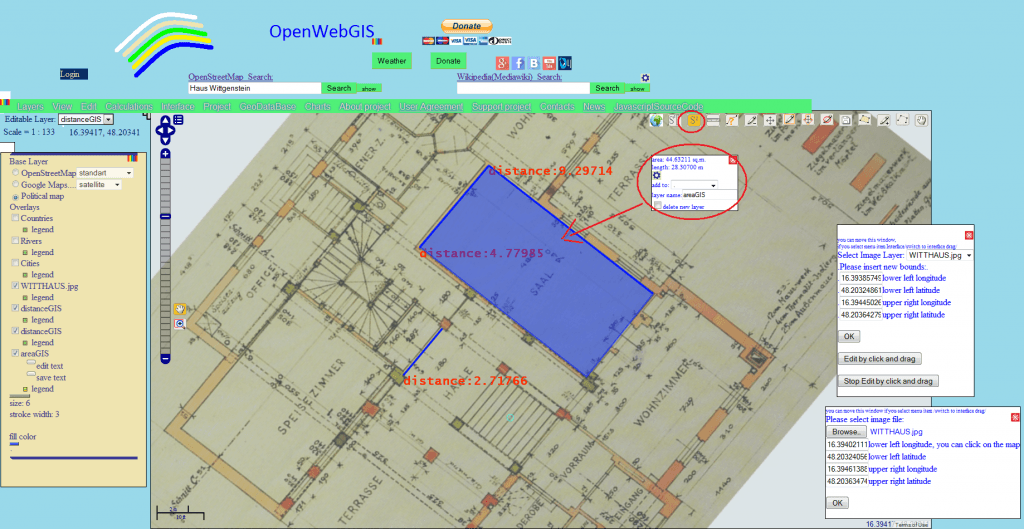
Similarly, measure the room area with the button “Mesuare area”.
Layers “distanceGIS” and “areaGIS” can be exported (using the menu items “Layers-> Export Layer to … format”) to other GIS formats: – gml, geojson, csv, kml. Thus, we can manually vectorize the drawing that you initially have only in raster form.
You can compare the dimensions shown in the drawing and the dimensions measured by OpenWebGIS. It is seen that they are almost identical.
The resulting drawing, enlarged to the desired size with labels applied by you, can be exported to the image using the menu item “View-> Export map to Image”. The upper left corner of the exporting window contains information about the export geo-referenced data. This is convenient, for example, to form the world-file and to use the received image in other GIS programs. It turns out that in this case the GIS works as a picture editor.
Exporting window with result drawing and vector layer export to the image
Let us briefly consider the use of the same approach in archeology.
We will study the plan of villa “House of Menander” in Pompeii constructed in the late 1st century BC. Find and position the map on this villa using the search bar of Wikipedia in the interface of OpenWebGIS “Wikipedia (Mediawiki) _Search:” Overlay the plan on the map, and then apply the photo of mosaic floor of the caldarium on the plan and measure its smallest details. The plan of the villa and photo of mosaic floor of the caldarium taken from here.
View on Google Maps of Villa “House of Menander” in PompeiiVilla “House of Menander” in Pompeii and its overlaid planVilla “House of Menander” in Pompeii and its overlaid planThe overlaid mosaic floor caldarium and its length, width and area were measured in OpenWebGIS (approximately)
As we can see from the picture above, rather small sizes were measured, in the same way online it can be possible to analyze and measure objects to centimeters and even less.
Interface of OpenWebGIS with functions list of Geomathematics module on the background of mosaic floor in Villa “House of Menander”, Pompeii
And then you can apply a variety of analysis functions of the extensive range of functions in the module Geomathematics of OpenWebGIS, but this is a theme for a separate article. Thus, OpenWebGIS allows to work with spatial objects both on the macro and micro levels.
In fact in this article, we see the description of some simple integration of GIS and CAD technology. Of course, in recent years the integration of these technologies in the desktop software is widely used in science and engineering. But it seems to me that now it is a rarity in online Web GIS. But the need for this among users and companies is increasing, and therefore the developers in this area still have a lot of work and interesting findings and perhaps even discoveries.
I think that this is really thought-provoking. You demonstrated some really detailed approaches with the rotation of the plan image to match the map, which then made me desire something further: importing vector based architectural plans/blue-prints. Perhaps even one step further, are there Web GIS’s that integrate with CAD to present such information? And of course that use case further shines a light on the zoom issue.
Anyhow – thanks! Good stuff.
Jan Militzer
9 years ago
In my opinion this is realy nice and it is a nice method for GIS rookies. But be careful with telling people that it is possible to measure things with this very high precision, because this is depending on a variety of factors. Starting by your reference which was google earth in many cases. Most of google earth images are very simple corrected VHR satellite images, the location accuracy of these images can be in ranges from meters to tens of meters, getting more inaccurate with rougher terrain. For this precision you need true-ortho images (in case of vienna this… Read more »
Thank you for your comment. I agree with you about the issues you have mentioned. Everything said by you should be taken into account while working with GIS.
In the last month the German website Spiegel-Online showed some nice examples of big-data combined with geodata. Geodata get’s more important with every GPS-enabled device that is sold,…
A priorized project of eGovernment Switzerland Usage and exchange of geodata is fostered by geo.admin.ch in a significant way. The Federal geoportal is operated by the Federal Office…
In my recent articles I was writing some hints and tutorials for creating a webmap. So what is the basic concept behind it and what are the possibilities.…
There are plenty of webmapping services out there. The best known might be mapbox, carto, arcgis online, google maps. But what they all share: they do not come…


I think that this is really thought-provoking. You demonstrated some really detailed approaches with the rotation of the plan image to match the map, which then made me desire something further: importing vector based architectural plans/blue-prints. Perhaps even one step further, are there Web GIS’s that integrate with CAD to present such information? And of course that use case further shines a light on the zoom issue.
Anyhow – thanks! Good stuff.
In my opinion this is realy nice and it is a nice method for GIS rookies. But be careful with telling people that it is possible to measure things with this very high precision, because this is depending on a variety of factors. Starting by your reference which was google earth in many cases. Most of google earth images are very simple corrected VHR satellite images, the location accuracy of these images can be in ranges from meters to tens of meters, getting more inaccurate with rougher terrain. For this precision you need true-ortho images (in case of vienna this… Read more »
Thank you for your comment. I agree with you about the issues you have mentioned. Everything said by you should be taken into account while working with GIS.