The new JSON Format GeoJSON allows you to easily embed geographical features in your leaflet webmap. Additionally you can create it very easily in the open source GIS QGIS aka Quantum GIS. In this tutorial I’ll show you how to export features to GeoJSON from QGIS and embed them into your leaflet map.
data creation
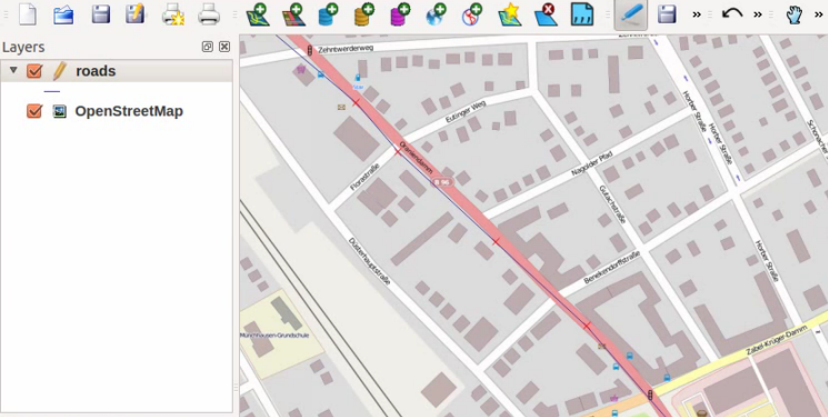
First you will need some data to map. We will open QGIS and create some lines we would like to show on our webmap:
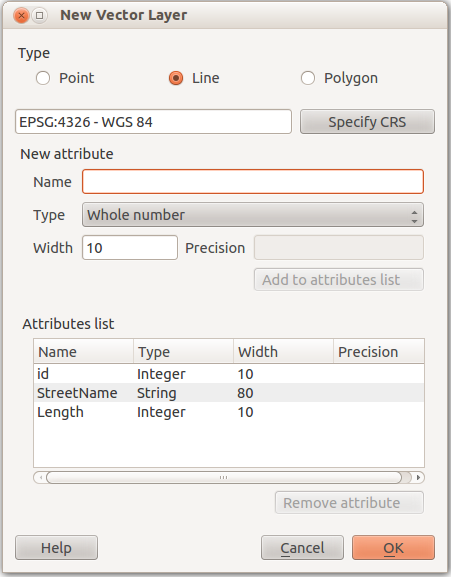
In QGIS for UBUNTU hit CTRL-SHIFT-N (which wasn’t working on my machine) or use the path Layer->New->New Shapefile Layer. We will see a dialog similar to this:
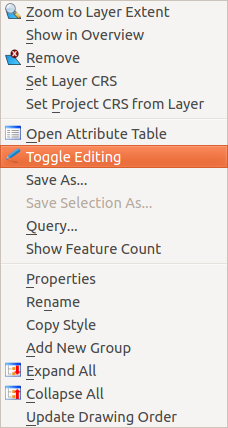
I saved it under the name roads.shp. Next up: create some features. This is easily done in QGIS as we just have to enable editing on the layer: right click on the layer and toggle editing:
Now we will add some vertexes to our layer, press the right mouse button to end the creation process and fill in desired atributes. In my case these are the approx. length of the road in km and the streetname. I would like to show both attributes in the end on my webmap.
As I have added enough streets I will save all the edits by pressing the save button. My dbf file for the shape file is now crowded with all the information I would like to show and we have the spatial attributes also given…
Next step: create the geoJSON. This is damn easy (If you’re on UBUNTU. It wasn’t working on Mac and I haven’t tried on WIN, can you comment?). Just right-click on the layer and choose “save as…” Now search for the geoJSON entry in the list of output formats. keep everything as it is as you probably don’t want to change the underlying projection, do you?
now you will see a file that is similar to this one here:
{
"type": "FeatureCollection",

"features": [
{ "type": "Feature", "id": 0, "properties": { "id": 0, "street": "number 1", "length": 1 }, "geometry": { "type": "LineString", "coordinates": [ [ 13.424244, 52.539179 ], [ 13.421705701409467, 52.539576815907466 ], [ 13.42183003062355, 52.539687723163105 ], [ 13.422166851598536, 52.540291556826226 ], [ 13.42236706832899, 52.540650784116721 ], [ 13.4226, 52.54064 ] ] } }
,
{ "type": "Feature", "id": 9, "properties": { "id": 10, "street": "number 2", "length": 10 }, "geometry": { "type": "LineString", "coordinates": [ [ 13.40031, 52.51801 ], [ 13.3996705721827, 52.517765112439875 ], [ 13.399670572182709, 52.517765112439861 ], [ 13.399176455188746, 52.517654943693323 ], [ 13.397880188568315, 52.517573576643279 ], [ 13.397615860238052, 52.518724568870446 ], [ 13.397225437613784, 52.519266719174603 ], [ 13.397065264229472, 52.519479922561445 ], [ 13.396694863278245, 52.519650484525975 ], [ 13.396414559855696, 52.519668758982903 ], [ 13.396134256433148, 52.519760131153504 ], [ 13.395183226963786, 52.520460644814797 ], [ 13.394102056619669, 52.5212646989009 ], [ 13.393401298063297, 52.521776362020844 ], [ 13.393501406428491, 52.521812909158513 ], [ 13.39383176403364, 52.521989553228643 ], [ 13.393921861562315, 52.522062647118865 ], [ 13.394974927632834, 52.521762139072038 ] ] } }
]
}
We need to change this so it can work as a javascript object. Just add a variable name in the beginning and use some square brackets and a semicolon and save it as roads.js:
var roads = [{
"type": "FeatureCollection",

"features": [
{ "type": "Feature", "id": 0, "properties": { "id": 0, "street": "number 1", "length": 1 }, "geometry": { "type": "LineString", "coordinates": [ [ 13.424244, 52.539179 ], [ 13.421705701409467, 52.539576815907466 ], [ 13.42183003062355, 52.539687723163105 ], [ 13.422166851598536, 52.540291556826226 ], [ 13.42236706832899, 52.540650784116721 ], [ 13.4226, 52.54064 ] ] } }
,
{ "type": "Feature", "id": 9, "properties": { "id": 10, "street": "number 2", "length": 10 }, "geometry": { "type": "LineString", "coordinates": [ [ 13.40031, 52.51801 ], [ 13.3996705721827, 52.517765112439875 ], [ 13.399670572182709, 52.517765112439861 ], [ 13.399176455188746, 52.517654943693323 ], [ 13.397880188568315, 52.517573576643279 ], [ 13.397615860238052, 52.518724568870446 ], [ 13.397225437613784, 52.519266719174603 ], [ 13.397065264229472, 52.519479922561445 ], [ 13.396694863278245, 52.519650484525975 ], [ 13.396414559855696, 52.519668758982903 ], [ 13.396134256433148, 52.519760131153504 ], [ 13.395183226963786, 52.520460644814797 ], [ 13.394102056619669, 52.5212646989009 ], [ 13.393401298063297, 52.521776362020844 ], [ 13.393501406428491, 52.521812909158513 ], [ 13.39383176403364, 52.521989553228643 ], [ 13.393921861562315, 52.522062647118865 ], [ 13.394974927632834, 52.521762139072038 ] ] } }
]
}
];
See all the steps above in the following video:
[youtube http://www.youtube.com/watch?v=CS0IOMuhWHc&w=560&h=315]
map creation
Now open up a new html document and add the following lines
<!DOCTYPE html>
<html>
<head>
  <title>Roads Webmap</title>
  <meta charset="utf-8" />
  <link rel="stylesheet" href="http://cdn.leafletjs.com/leaflet-0.5/leaflet.css" /> <!-- we will us e this as the styling script for our webmap-->
</head>
<body>
  <div id="map" style="align: center;width: 500px; height: 500px"></div> <!-- this is the initial look of the map. in most cases it is done externally using something like a map.css stylesheet were you can specify the look of map elements, like background color tables and so on.-->
  <script src="http://cdn.leafletjs.com/leaflet-0.4.5/leaflet.js"></script> <!-- this is the javascript file that doeas the magic-->
  <script src="roads.js"></script><!-- this is our datafile -->
  <script> // we will setup our map here. </script>
  </body>
</html>
Now lets come to the map creation. First we will need a map object that lets us embed our data and basemaps:
	var map = L.map('map').setView([52.52,13.384], 13);
	L.tileLayer('http://{s}.www.toolserver.org/tiles/bw-mapnik/{z}/{x}/{y}.png').addTo(map);
As you see I’ve already set up some start parameters according to Berlin, using the .setView() method. First there is the pair of coordinates and second th initial zoom level that fit my needs. The second line adds a basemap that is provided by the wikipedia toolserver
. After this we can go straight ahead and add our geoJSON object to the map:
var steets = new L.geoJson(roads, {
		//some options
	}).addTo(map);
As you can see, we will add the layer direct to the map. But until now the layer is only shown and clickable (the pointer is changing when you hover over it) but no popup is shown. We will solve this right away by adding another function that is called when we click “onEachFeature”. But we need to make sure that when we assign the variable “streets” the function is already known. So we will define one:
function onEachFeature(feature, layer) {
    if (feature.properties) {
        layer.bindPopup("some crazy HTML");
    }
}
Instead of “some crazy HTML” you can also refer to the properties of the feature. In our case this could look like:
layer.bindPopup("<b>" + feature.properties.street + "</b> is " + feature.properties.length + "km long.");
to give an idea of the length of the street in the popup. This function will be called by the geoJSON itself. Simply add the line so the variable streets will be called like this:
var streets = new L.geoJson(roads, {
		onEachFeature: onEachFeature
	}).addTo(map);
And actually this is it. You can download the two files here:
– data file in geojson style
– index.html which sets up the map
The example above looks like this in the end:
Do you know how I would stylize a featurecollection of markers based on their properties? I tried using switch, case, and return but I can’t get it to work. Thanks
One year and a half later.. works fine in W7, QGIS 2.6