Objective
If you want to connect maps and images with other spatial data each data set needs to be “digitally located”. Each pixel of a map has in its original form only a reference according to the whole image: A pixel may be the 3216th in the 212th row but thats all for the beginning. You can translate this location (x=3216, y=212) to a geographic and therefore “real” spatial system by georeferencing it by using the defined coordinate system which the map is based on. We will show you, how this works.what do you need
- Quantum GIS (examples shown in QGIS 2.16.2
- a scanned map either in JPG or as a tif-file
Time Effort
approx. 5-10 minutesStep 1 – Preparational Steps
We will start with a new project and use Sentinel-2 image as a reference for this one. Sentinel-2 Images are normally shipped with the UTM projection using the wgs84 reference ellipsoid. So we will project the map onto this target SRS (Spatial Reference System). For downloading the Sentinel-2 image I was using the Earth Explorer and the image with the entity ID S2A_OPER_MSI_L1C_TL_SGS__20160719T112949_20160719T165219_A005611_T30UWD_N02_04_01. The different bands are combined to a composite image for the purpose of a reference using the merge function in the raster dialog of QGIS (Raster->Miscellaneous->Merge…) and choosing the bands four as red, three as green and two as blue: You will see, that the CRS (Coordinate Reference System) switched automatically to EPSG:32630 which corresponds to UTM Zone 30 using the WGS84 ellipsoid. Now we are ready. Our map will be projected into this UTM Zone.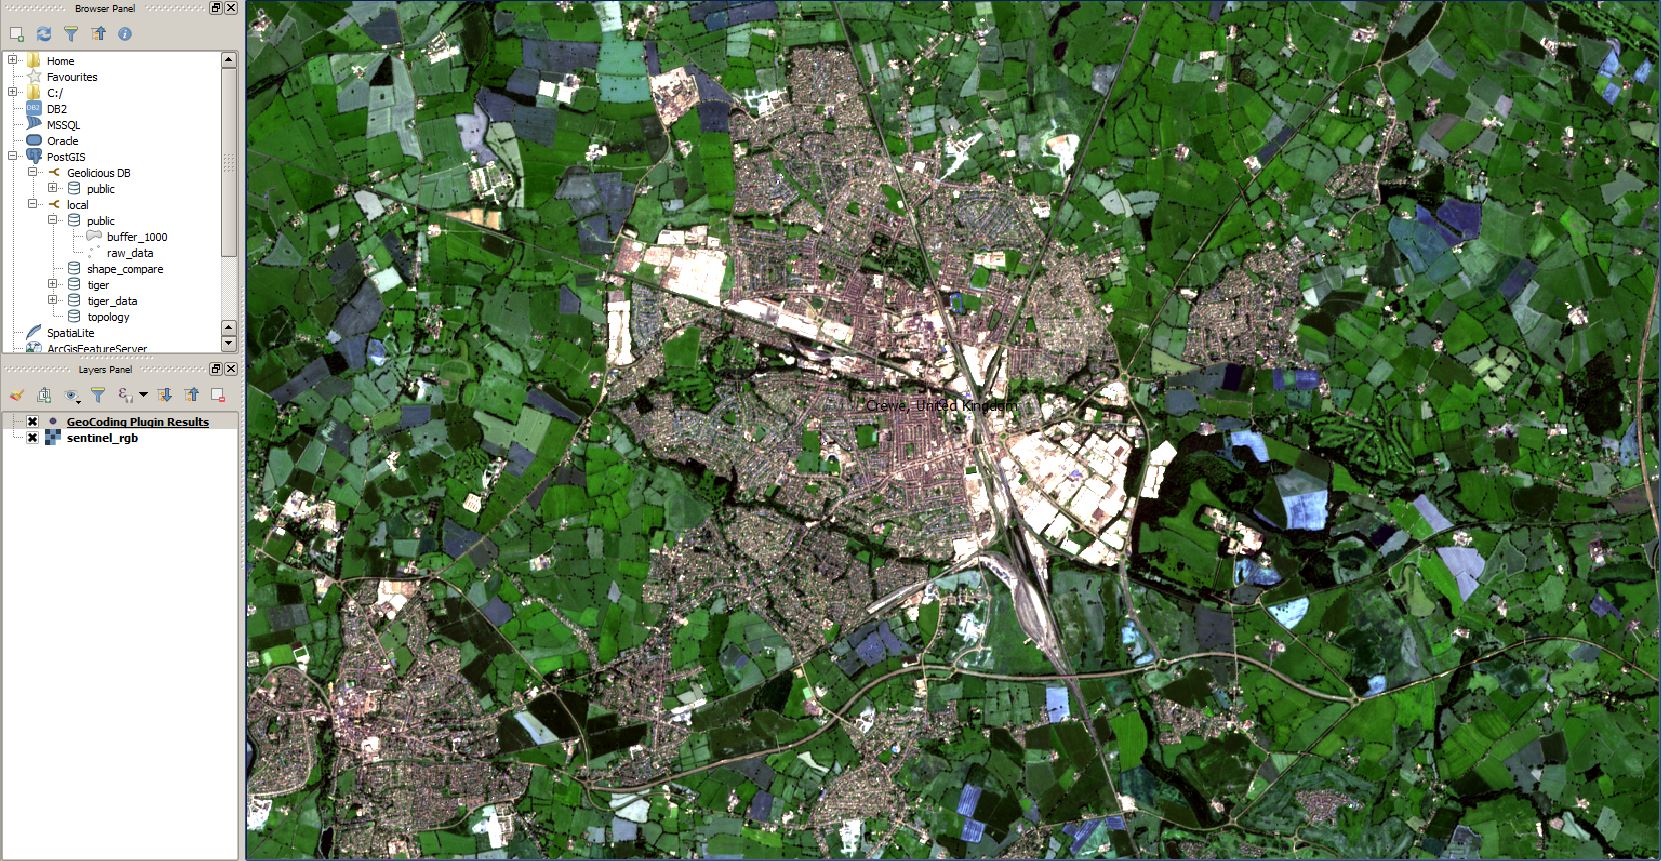
Step 2 – Working With the Map
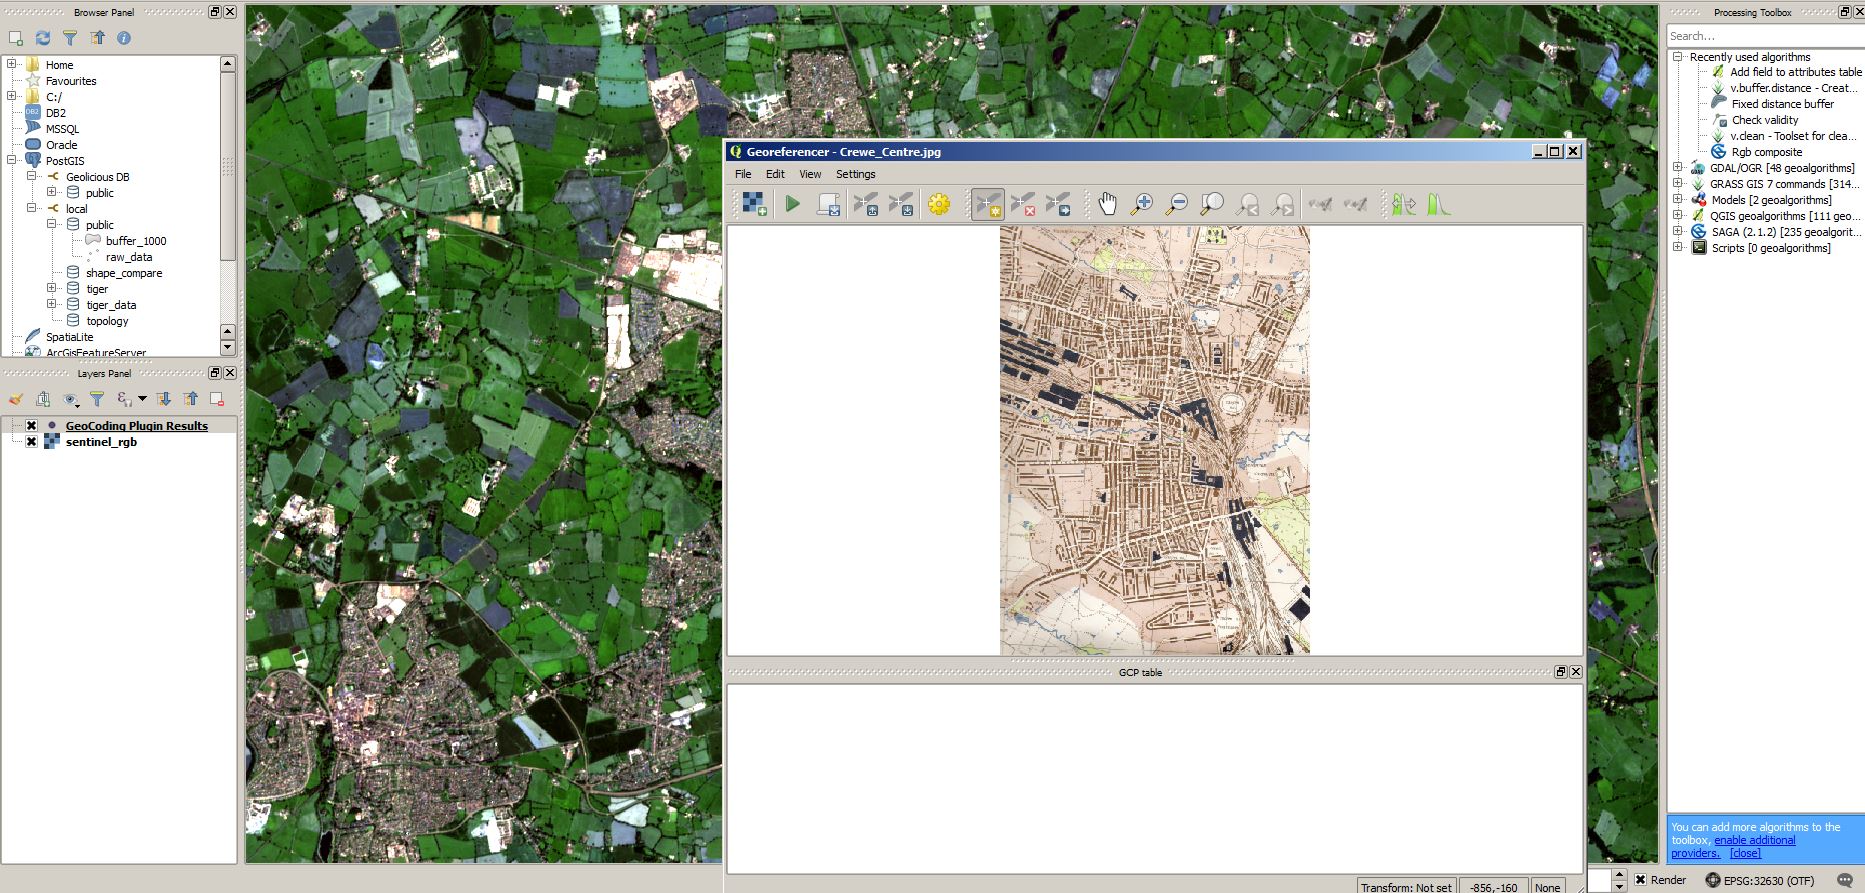
Click now on Raster->Georeferencer->Georeferencer. In the new window you need to open your scanned image by clicking on Open Raster and choose your desired map. After this you will see the map in the Georeferencer As we can’t see any proper coordinates of the crosses, we need to do a visual editing by using Ground Control Points (GCPs) as a reference. Good GCPs are easy to see and differentiate, easy to distinguish and valid throughout the years of the image material:- Mountain tops
- Monuments
- Buildings
- Street crossings
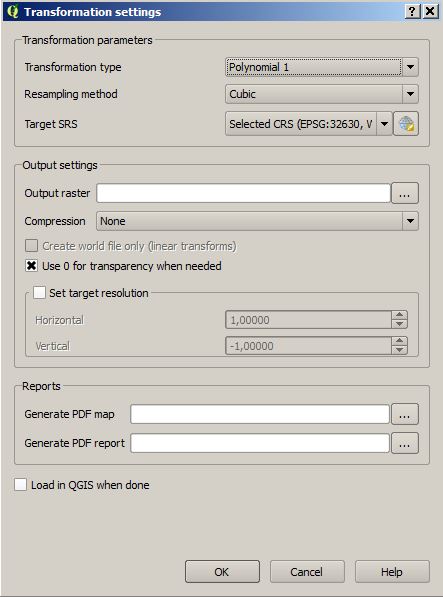
The transformation type defines the complexity of the mathematical computation to transform multiple points into their referenced coordinates. This is easy for one point but the map or image has multiple pixels and in the wanted result every pixel should be referenced correctly, shouldn’t it? To allow a stretch in x, y and combined xy direction we need at least three points for the referenciation. If you don’t understand why, here is a simple explanation using a sheet of paper:
There are several other transformation types which also allows “error free” transformation like the spline transformation but this is just “bogus”.
The resampling type defines the way the pixel value in the referenced image will be calculated. Nearest neighbor will use the pixel value that has most overlap. You might ask why is there an “overlap”?! If you transform a pixel it will not be quadratic anymore but more or less a rectangle or even further complex shape. So the question will arise: “What is the pixel value (quadratic) of something that consists of other non quadratic pixels”.
- Nearest Neighbour: takes the pixel value from the most overlapping/nearest pixel and assign this value to the target pixel (which might result in rectangular steps in the target image!)
- linear: will take an average of the surrounding pixels (might get a bit “blurry” but still one of my favourites)
- cubic: will take even more pixels then bilinear into account (increasing blur effect!)
- Compression should be none. So an image file and the values in it will not be distorted in any way.
- Define your target images name and location in the Output raster field.
- As the Target SRS you need to choose your defined target coordinate system.
- Generate a PDF map if you like.
- Generate a PDF report if you like. It will have the values of RMSE in case your interested in your performance
- Load in QGIS when done is often a good choice
Step 3 – Processing it
After you have marked the four points, click on the green arrow Start Georeferencing. If you missed to fill in the properties it will be now the best time to do so (fig. 2).Click on “OK” and enjoy a small coffee or tea.
Step 4 – Quality Analysis
There are several ways to check the quality of the georeferenciation.First: Use your eyes 😉 By simply adjusting the opacity of a layer you can check whether this layer fits fine into your already referenced material (in our case the Sentinel-2 and OSM data) RMSE You can try your best and search for a lot of GCPs. This will affect the overall quality of your model. The rule of thumb here is: The RMSE should be less then 1/2 a pixel. Here are some good thoughts on that.

Very awesome.Nice