Within that tutorial I will show you how to:
- add a geoJSON file using pure Leaflet
- open a geoJSON file with D3
- open a TopoJSON file with D3
- add a map-overlay to a leaflet map using D3
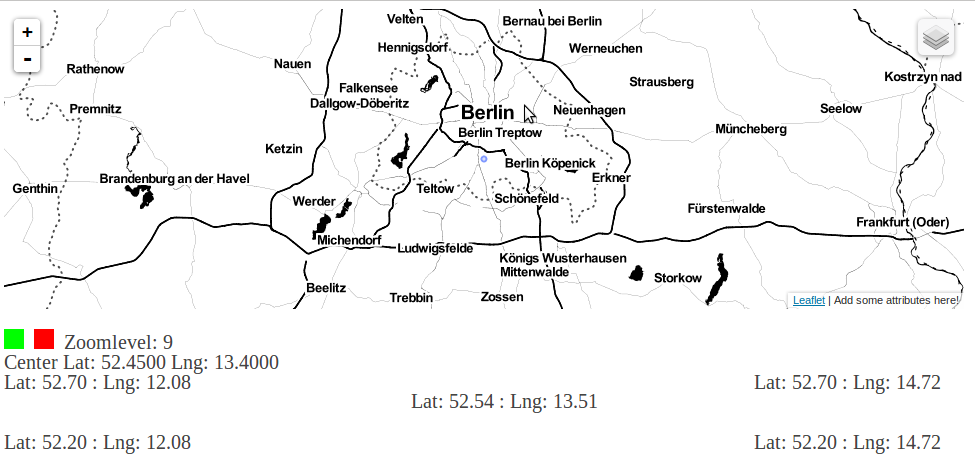
Again…we begin with a simple map … already seen in D3 mapping basics and in geoJSON & Leaflet
<!DOCTYPE html>
<html>
<head>
  <title>Testmap</title>
  <meta charset="utf-8" />
  <script src="http://cdn.leafletjs.com/leaflet-0.6.1/leaflet.js"></script>
  <style>
  @import url(https://cdn.leafletjs.com/leaflet-0.6.1/leaflet.css);
  </style>
</head>
<body>
  <div id="map" style="width: 960px; height: 300px"></div>
  <script>
  var map = L.map('map').setView([52.52,13.384], 13);
  var toolserver = L.tileLayer('http://{s}.www.toolserver.org/tiles/bw-mapnik/{z}/{x}/{y}.png');
  var stamen = L.tileLayer('http://{s}.tile.stamen.com/toner/{z}/{x}/{y}.png', {attribution: 'Add some attributes here!'}).addTo(map);
  var baseLayers = {"stamen": stamen, "toolserver-mapnik":toolserver};
  L.control.layers(baseLayers).addTo(map);</script>
 </body>
</html>
Add a geoJSON file using pure Leaflet
You should know how to do this! Just add some very simple data to the map, as we have already done it in a previous post!
Import the data file…
<script src="roads.js"></script>
…add the data to the map…
  var geojson = L.geoJson(roads, {
      onEachFeature: onEachFeature
  }).addTo(map)
…define the ‘onEachFeature’ function…
function onEachFeature(feature, layer){
   if (feature.properties) {
        layer.bindPopup("<b>" + feature.properties.street + "</b> is " + feature.properties.length + "km long.");
    }
}
Can you remember when this function is called and its sense? The documentation says, a function that is called while each element is created! Means only called one time when map is initialized, what enables you to add pop-ups and such things!
Finally, throw the geoJSON-data into an ‘object’ as we made it for the ‘baseLayers’…
var overlays = {
 "geoJson": geojson
};
…and add it to the layer control
L.control.layers(baseLayers, overlays).addTo(map);
Let’s try to make that with D3.
Currently, we have a basic map with geoJSON data overlay, can switch between layers and can un-/show the overlay! We can click it and get information on it visualised in a pop-up!
As cool as it is … I’d like to open the data manually, not by importing it, whereby I’d have more access to the data!
In this relation…D3 offers another cool tool ‘d3.json()’ … it helps you to work with geoJSON files in an elegant way.
We’ll use the same data as in the previous (geoJSON & Leaflet) tutorial –> roads.js
<script src="roads.js"></script>
NOTICE! … We cannot use this file…as it is!
Can you remember … we had to add some content to the ‘roads.js’ – file … meaning the ‘featureCollection’ has to be allocated as variable (‘roads’), to be accessible by Leaflet.
You can either use the original data (when you made the previous tutorial) or you reset the file and save it as roads2.js, like I did:
{
"type": "FeatureCollection",

"features": [
{ "type": "Feature", "id": 0, "properties": { "id": 0, "street": "number 1", "length": 1 }, "geometry": { "type": "LineString", "coordinates": [ [ 13.424244, 52.539179 ], [ 13.421705701409467, 52.539576815907466 ], [ 13.42183003062355, 52.539687723163105 ], [ 13.422166851598536, 52.540291556826226 ], [ 13.42236706832899, 52.540650784116721 ], [ 13.4226, 52.54064 ] ] } }
,
{ "type": "Feature", "id": 9, "properties": { "id": 10, "street": "number 2", "length": 10 }, "geometry": { "type": "LineString", "coordinates": [ [ 13.40031, 52.51801 ], [ 13.3996705721827, 52.517765112439875 ], [ 13.399670572182709, 52.517765112439861 ], [ 13.399176455188746, 52.517654943693323 ], [ 13.397880188568315, 52.517573576643279 ], [ 13.397615860238052, 52.518724568870446 ], [ 13.397225437613784, 52.519266719174603 ], [ 13.397065264229472, 52.519479922561445 ], [ 13.396694863278245, 52.519650484525975 ], [ 13.396414559855696, 52.519668758982903 ], [ 13.396134256433148, 52.519760131153504 ], [ 13.395183226963786, 52.520460644814797 ], [ 13.394102056619669, 52.5212646989009 ], [ 13.393401298063297, 52.521776362020844 ], [ 13.393501406428491, 52.521812909158513 ], [ 13.39383176403364, 52.521989553228643 ], [ 13.393921861562315, 52.522062647118865 ], [ 13.394974927632834, 52.521762139072038 ] ] } }
]
}
It is necessary to do that, as D3 can/wants to handle geoJSON-files directly. And this is advantageous especially for huge datasets!
I don’t want to be forced to add some content to a file of, say 1000 elements, before I can really use it… that is not a cool workflow, isn’t it?
So … add the D3-library…
<script src="http://d3js.org/d3.v3.min.js"></script>
…open the file and examine the loaded data …
d3.json("roads2.js", function(collection) {
    console.log(collection)
})
…do you see a ‘featureCollection’? Good … everything was loaded!
Notice! Everything that follows has to be included to this ‘d3.json({})’ command!
But what can I do with this data? … hmmm … let’s compare it to the ‘roads.js’ data…
console.log(roads)
…aha…’roads.js’ –> offers an array containing one ‘featureCollection’-object and ‘roads2.js’ –> offers one ‘featureCollection’-object … ok .. that means…
   console.log([collection])
   console.log(roads)
…now they are identic … wherefore … I could also add the ‘roads2.js’ data as an overlay!
d3.json("roads2.js", function(collection) {

    console.log([collection])
    console.log(roads)

    var roadsTest = [collection];

    var geojson_d3 = L.geoJson(roadsTest, {
        onEachFeature: onEachFeature
    })

    overlays["geojson_d3"] = geojson_d3;

    L.control.layers(baseLayers, overlays).addTo(map);
  })
(Don’t forget to remove the ‘L.control.layers()’ at its old position…we add it here again!)
Cool .. now we’re able to open a geoJSON file without editing it previously! In result, we’ve got the data 2 times in the map and can select them in the layer control!
Add TopoJSON using D3
And you can do even more with ‘d3.json()’…did you already here about TopoJSON? You should…the file size of geoJSON data to can be reduced up to 80%.
Explaining how to make a TopoJSON file would take too long… so … use my file … or get some background knowledge and make it on your own:
- basic information
- how you have to ‘read’ the data
- installation on Ubuntu 12.04
- how I used it the first time
- how the author (Mike Bostock) describes how to use it
I’ll go on by making a TopoJSON – version of our dataset ‘roads2.js’ (use the reseted version!!!)
topojson --id-property id -p -o roads2_topo.json roads2.js
–id-property –> the property which is used as ID,
-p –> transfer all properties (give it a value and it transfers only this one),
-o –> output file
Add the corresponding library ‘topojson.js’ to our example:
<script src="http://d3js.org/topojson.v1.min.js"></script>
Open the TopoJSON-file and examine it…
d3.json("roads2_topo.json", function(error, topology) {
	console.log(topology)
})
…looks not familiar, doesn’t it? But don’t worry it’s pretty simple to get it as well-known geoJSON…
var collection2 = topojson.feature(topology, topology.objects.roads2);
var roadsTopoJSON = [collection2];
…there you go! Now, we’ll just make the same as above (again…remember to replace the ‘L.control.layers’)…
    d3.json("roads2_topo.json", function(error, topology) {
      //console.log(topology)
      var collection2 = topojson.feature(topology, topology.objects.roads2);
      var roadsTopoJSON = [collection2];

      //console.log(roadsTopoJSON)

      var geojson_tj = L.geoJson(roadsTopoJSON, {
          onEachFeature: onEachFeature
      })

      overlays["geojson_topojson"] = geojson_tj;

      L.control.layers(baseLayers, overlays).addTo(map);

    })
…that’s it! Now, we’ve got our data 3 times in the map…each one opened in a different way!
That was more elegant, right? Always remember…this is an example with a tiny, cute dataset. TopoJSON is getting even more usefull…the more data you want to visualise! But I think we’ll see that in another tutorial…
Finally, I’d like to show you how we could do such a data overlay completely without Leaflet…no, sorry…we will still use it for the background map.
Making a Leaflet map-overlay with D3
Do you remember how we’ve worked with D3 in the previous tutorials (Basics, Mapping Basics) … you should …you need that knowledge now!
We begin by adding a ‘svgContainer’ to the overlay pane of the Leaflet-map (add the following lines before the d3.json() commands to make them global)…
var svgContainer = d3.select(map.getPanes().overlayPane).append("svg");
…whereby we have ensured that everything that will be visualised within that ‘svgContainer’ is fixed to the current map view…meaning you can drag the map and the ‘svgContainer’ follows.
Now I’d like to have a clean ‘playground’, so we add a group…
var group= svgContainer.append("g").attr("class", "leaflet-zoom-hide")
…and directly define it as a certain ‘class’ of Leaflet, whereby the overlay is hidden on all zoom events!
Now we initialize a geometric object…a simple ‘path’…
var path = d3.geo.path().projection(project);
…you see … we have to define a projection … which will be a function, in our case…
  function project(point) {
    var latlng = new L.LatLng(point[1], point[0]);
    var layerPoint = map.latLngToLayerPoint(latlng);
    return [layerPoint.x, layerPoint.y];
  }
…that reprojects the overlay to the corresponding svg layer point, by:
- making a new ‘LatLng’ object (‘latlng’) from the offered ‘point’
- geting a ‘LayerPoint’ objet from ‘latlng’ (‘layerPoint’) offered by the Leaflet map
- and return an array (same form as input) filled with the ‘layerPoint’ coordinates
OK…now we are ready to add some data to this ready prepared ‘svg overlay playground’…
      var feature = group.selectAll("path")
          .data(collection2.features)
          .enter()
          .append("path")
          .attr("id","overlay");
…same scheme that we have already applied in the previous tutorials, rigth?! So you see … I use the TopoJSON data (‘collection2’) … add the ‘path’ with our individual projection … and set the id to ‘overlay’ … but wait … we need a style for that…
  #overlay{
   fill:None;
   stroke:#ff00ff;
   stroke-width:4px;
  }
…copy that into the head!
<styles></styles>
But we still do not see our data! We have to reset the ‘svgContainer’ and the ‘group’ to the bounds of our data…unless it would stay invisible as we have not defined the extent of the ‘svgContainer’ so far!
Get the bounds of your data…
var bounds = d3.geo.bounds(collection2);
…and add this function, where we use the bounds to reset our ‘playground’…
function reset() {
     var bottomLeft = project(bounds[0]),
     topRight = project(bounds[1]);

     svgContainer.attr("width", topRight[0] - bottomLeft[0])
         .attr("height", bottomLeft[1] - topRight[1])
         .style("margin-left", bottomLeft[0] + "px")
         .style("margin-top", topRight[1] + "px");

     group.attr("transform", "translate(" + -bottomLeft[0] + "," + -topRight[1] + ")");

    feature.attr("d", path);
 }
…and finally … call the function …
reset();
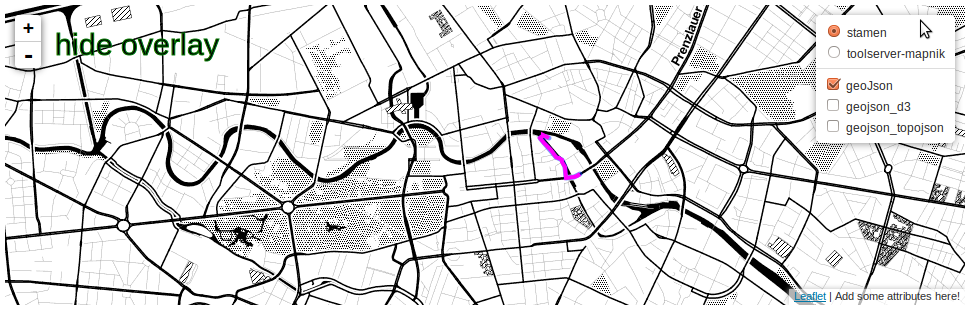
Do you see your data in pink? It works…drag and zoom it…did you notice the effect of the class ‘leaflet-zoom-hide’? We can drag it … but it fails on zooming! That is because we have to reset the extent of the ‘svgContainer’…they are not correct after zooming!
How to do that…easy…just call the function ‘reset()’ on each zoom event…sounds familiar right…we’ve used that function already…
map.on("viewreset", reset);
That’s it…now we’ve got it fixed on the map!
Lastly, as I want to make the same as before…we have to open a pop-up, when we click on the map…
      feature.on("mousedown",function(d){
        var coordinates = d3.mouse(this);
        //console.log(d,coordinates,map.layerPointToLatLng(coordinates))
        L.popup().setLatLng(map.layerPointToLatLng(coordinates))
                 .setContent("<b>" + d.properties.street + "</b> is " + d.properties.length + "km long.")
                 .openOn(map);
      });
…and I’m sure you want to see something, that is only possible with D3…
feature.on("mouseout",function(d){
        d3.select(this).transition().duration(2500).ease('bounce')
          .style("stroke","#0f0")
          .attr("transform", "translate(0,-50)");
})
OK…I hope this tutorial gave you a good 1st impression of the differences between the possibilities on handling geoJSON files with Leaflet and D3, the handling of TopoJSON and how you manage a ‘manual’ data overlay with the help of D3.
Don’t worry! I won’t finish without something to brood over … we cannot hide & show our individual overlay, in contrast to the Leaflet overlays! Think about how you would do that…I added my version to the final result!
Get the files:

Thank you very much for all this tutorial ! But I’ve a problem with the part “Add TopoJSON using D3”
I’ve a message with firebug :ReferenceError: overlays is not defined
If
I add var overlays = {“geoJson”: geojson}; I’ve to add before ” var
geojson = L.geoJson(communes, { onEachFeature:
onEachFeature}).addTo(map)” But I don’t want to manually change the code
of my GeoJson for make a Javascript.
How can I do that please ?
Thank you very much.