
Have you seen “the story maps” created on the ESRI website (http://storymaps.arcgis.com) or for that matter from http://storymap.knightlab.com/ or http://mapstory.org/. They are all frameworks for you to create “a story” with geographic connections, and they achieve this more or less successfully.
Common for all of the above are that they are services, depending on the on-line framework. This makes it possible to present a more user friendly experience when you create the story, but at the same time you loose some flexibility and you need to be on-line.
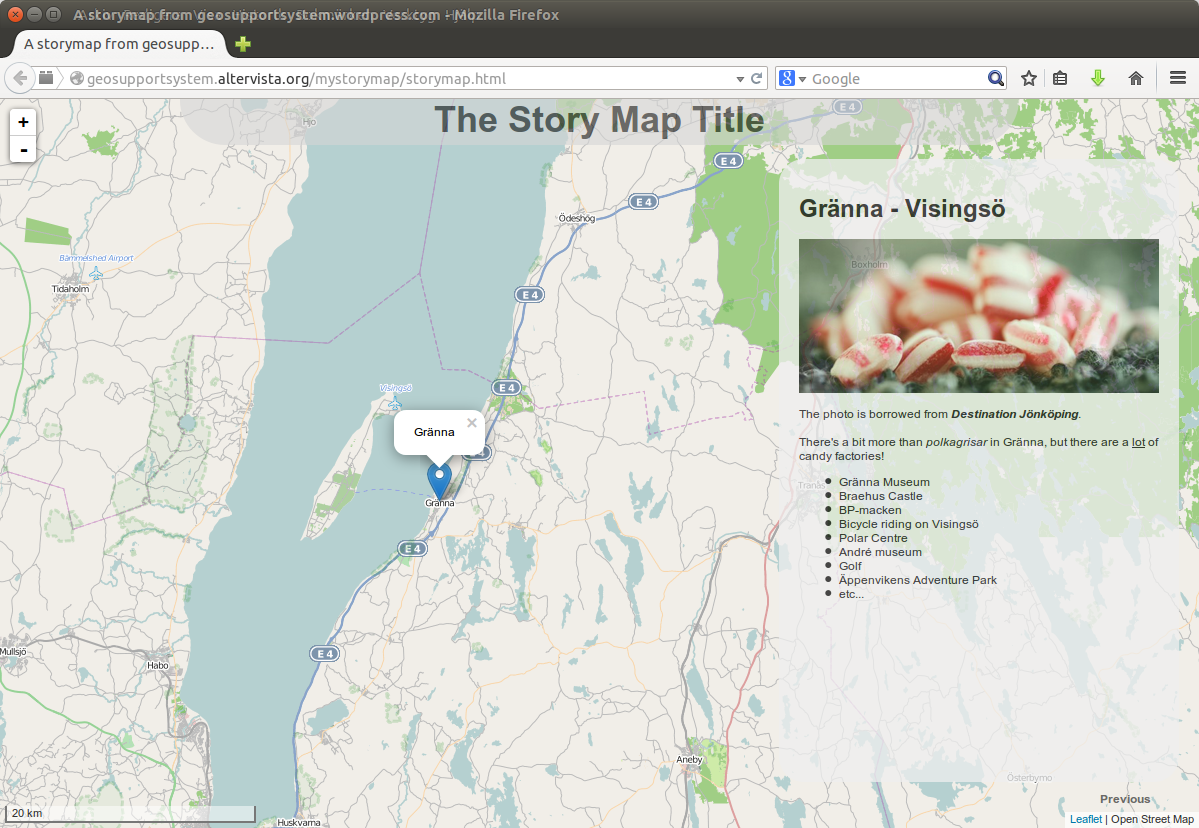
Here I’ll show how you can build a storymap yourself based on Leaflet maps and JavaScript. If you like, it’s not hard to change the script from Leaflet to OpenLayers or any other favorite JavaScript mapping framework. If you want to use the files off-line, you need to change the Leaflet paths to local sources. Another huge benefit of creating your own story files is that it is very easy to use your own map services as base maps. This is however not covered in the article.
My storymap is based on three files:
- storymap.html (main file where all necessary changes can be made)
- storymap.css (style for the story with among other things placements and size of elements)
- storymap.js (this is where the magic happens)
In this post I’ll leave the *.js and *.css file out, and focus on the *.html file. If you have no experience with styles and javascript, this is all you should need to get started, and if you know your way around styles and javascript, it shouldn’t be a problem anyway.
The storymap.html file can be renamed to your liking, but you shouldn’t change the other file names, and you need to keep the three files in the same place (or you need to make some changes to the code).
Any text or values that you will be likely to want to change is commented with a “” or “// “ type comment, depending on whether it’s a html comment or a comment inside javascript.
The first line you may want to change is the window title:
<title>A storymap from geosupportsystem.wordpress.com</title>
The main title of the story, that is always shown on the map can also be changed:
<div id="title">The Story Map Title</div>
If you like you can change the text for the “show previous” button:
<div id="rewind">Previous</div>
To make things easier a few variables have been broken out of the javascript file and listed in the html file.
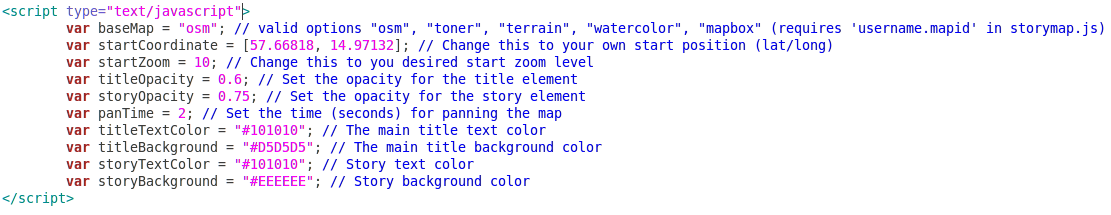
The comments on each variable should be enough to help you edit the values to your liking. You don’t have to change anything here (except maybe the location), but these are the fewest possible variables that can make the most visible change to your story. The variables are:
- baseMap – you can select from Open Street Map, most Stamen maps and MapBox maps.
- startCoordinate – The center coordinate in latitude and longitude that the story starts with.
- startZoom – Initial zoom level. During the story the user can change this, but it resets as the story restarts.
- titleOpacity – Set transparency of the main title
- storyOpacity – Set transparency of the area holding the story content
- panTime – How many seconds should it take to pan between places
You can also change color of the title text and background, as well as the story text and background.
Separated from the story you can change the starting content of the story area in the variable “startText”. This can hold more or less any html content, but you need to keep two things in mind for it to work. First, no line breaks. Everything should be on a single line (one variable). Second, don’t use double quotations (“) inside the variables, if you need to, use single quotations (‘) or as text you can use html code ( ” ) or escape character ( \” ).
The main story is created by three list variables:
- position – each story center coordinate in latitude and longitude.
- bubbleText – a pop-up text for each location (this can be deactivated or hidden/shown as default)
- storyText – the main story content with the same type of content as the starting text above.
In the story area I’ve prepared styles for headlines (use the
<h1></h1>
tag) and images (
<img alt="" />
tag). If you want to include video from YouTube and adapt the size of the video to the story area the same way as images do, then you must give the embedded code the class name “videoWrapper” and remove any height and width settings (see the example code in the file).
You can download the three files from GitHub (use this link: https://github.com/klakar/mystorymap/archive/master.zip) or you can explore the files “live” if you follow this link: http://geosupportsystem.altervista.org/mystorymap/storymap.html.
Using MapBox – The storymap is prepared for MapBox maps in the background. But it’s not enough to change the baseMap variable to “mapbox”, you also need to supply the “username.mapid” for the map you wish to use. You do this in the “storymap.js” file on row 50 (may change).
Screen Size – The StoryMap will adapt to different screen sizes, but vertical orientations (smart phones for example) and very small screens may appear hard to read and/or navigate.
This was my first post at DG and I picked one I wrote a few weeks ago, so you may already have seen it. However, there will likely be more articles coming from my keyboard on this site in the future.

Hey Klas, really nice article about flexible storymap building. Welcome to digital-geography.com!!
[…] post Create your own StoryMap appeared first on Digital […]
I bookmarked this post knowing it would be useful. I’m going to be using this template Tuesday as a way of showing a more ESRI-friendly crowd other story mapping platforms. Thanks for sharing this, Klas!
please visit of similar “story map” … http://www.mygpspin.com
This is a really great starter for anyone making a storymap! How can I set a custom zoom level for each spot on the map as it steps through the story? I would like to be able to set a custom zoom level for each story position. I am currently searching on the leaflet.js site to find the answer. Thanks!
This is a great resource, thank you!! Is there a way to include shapefiles within? I’d like to overlay shapefiles showing municipal boundaries and represent their attributes (population, etc) thematically.