If I would like to adjust a shape file I normally used the way over an excel file or a text file to get a table and to join this with an existing shape file. Due to the sp and rgdal packages in R you can manipulate shapefiles directly in R:
install.packages("sp","rgdal")
library("sp","rgdal")
now lets map the world boarders. You can find a little dataset for that here: thematicmapping.org.
Now lets load the shape file (after decompressing the archive):
ogrListLayers("TM_WORLD_BORDERS_SIMPL-0.3.shp") #will show you available layers for the above dataset
shape=readOGR("TM_WORLD_BORDERS_SIMPL-0.3.shp", layer="TM_WORLD_BORDERS_SIMPL-0.3") #will load the shapefile to your dataset.
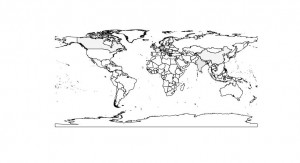
plot(shape) #to get an overview
and of course you can work with the data:
shape$AREA[shape$NAME=="Germany"]
You are also able to create a new attribute and use the “match” function to create new data in distinct objects like countries.
shape$members = 1:nrow(shape) #adds the attribute members
shape$members[match(c("Austria","Germany","China","United Kingdom", "Switzerland", "Canada", "Ireland", "India","Poland","South Africa", "France","New Zealand", "Italy"), shape$NAME)]=c(3,6,1,2,24,1,2,2,1,1,2,1,2) #will make new values at given countries
plot(shape, col=gray(1-shape$members/max(shape$members))) #adjust the colorramp
writeOGR(shape, "/home/rikl/wd_r/", "Rmetric_participants", driver="ESRI Shapefile") #save it on your drive.
ENJOY your shape file!


