OpenRouteService API: A Leaflet example for Isochrones

The page OpenRouteService.org is a very easy to use website which provides routing from A to B via C. It also allows to choose between different routing types for trucks, pedestrians or bicycles and isochrone analyses based on time and distance. In this article I would like to show you, how to embed the OpenRouteSevrice API into your very own Leaflet based webmap.

The Leaflet Basics

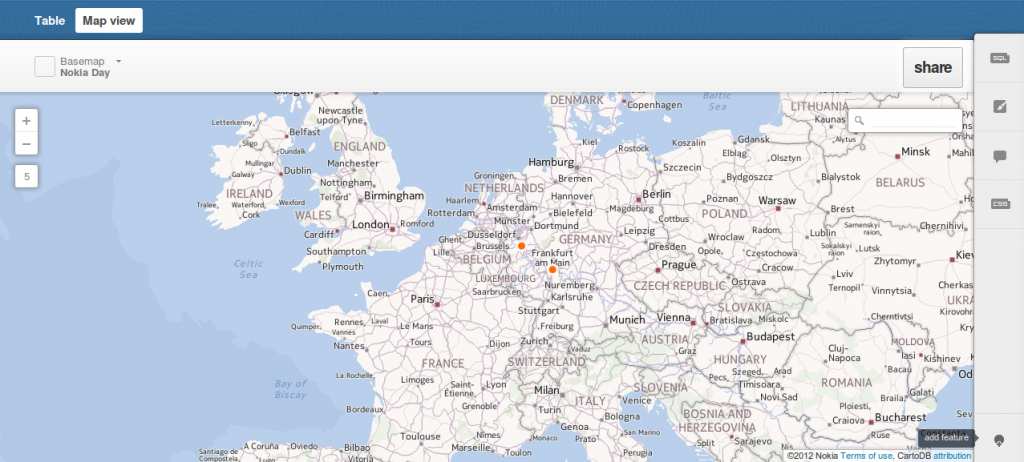
We will start with a very simple Leaflet based webmap: a basemap and a simple geojson point dataset:
<html>
	<head>
		<title>A fullscreen ORS webmap</title>
		<meta charset="utf-8" />
        <link rel="stylesheet" href="https://cdnjs.cloudflare.com/ajax/libs/leaflet/1.2.0/leaflet.css"  />
        <script src="https://cdnjs.cloudflare.com/ajax/libs/leaflet/1.2.0/leaflet.js"></script>
        <style>
            body {
                padding: 0;
                margin: 0;
            }
            html, body, #map {
                height: 100%;
                width: 100%;
            }
        </style>
    </head>
    <body>
		<div id="map"></div>
        <script>
             var map = L.map('map').setView([53, -1], 10);
            L.tileLayer('https://{s}.tile.openstreetmap.org/{z}/{x}/{y}.png', {
                maxZoom: 18
            }).addTo(map);
            data = {
                "type": "FeatureCollection",
                "features": [
                    {
                        "type": "Feature",
                        "properties": {
                            "name": "Pub"
                        },
                        "geometry": {
                            "type": "Point",
                            "coordinates": [
                                -1.1669,
                                52.956
                            ]
                        }
                    },
                    {
                        "type": "Feature",
                        "properties": {
                            "name": "Pub New"
                        },
                        "geometry": {
                            "type": "Point",
                            "coordinates": [
                                -1.1428,
                                52.955
                            ]
                        }
                    }
                ]
            }
            var markers = L.geoJSON(data).addTo(map);
        </script>
    </body>
</html>
As you can see: we do have a basemap and two markers. Both elements can act as an input provider of routing information for the API. But we would like to make this individually based on the input. Therefore I am using the context menu plugin for Leaflet. I add the contextmenu as an option for the map as well as for the markers. Yet the markers contextmenu depends on eachn feature I will use the onEachFeature functionality from Leaflet:
            var map = L.map('map',{
                contextmenu: true,
                contextmenuWidth: 140,
                contextmenuItems: [
                    {
                        text: 'get Isochrones',
                        callback: getAccess
                    }
                ]
            }).setView([53, -1], 10);
// and the geoJSON marker:
            function onEachMarker(feature, layer){
                layer.bindContextMenu({
                    contextmenu: true,
                    contextmenuWidth: 140,
                    contextmenuItems: [
                        {
                            text: 'get Isochrones from marker',
                            callback: getAccessFromMarker
                        }
                    ]
                })
                layer.bindPopup(feature.properties.name);  
            };
            var markers = L.geoJSON(data, {
                onEachFeature: onEachMarker
            }).addTo(map);
As you can see, we call two different functions for the isochrones. So here comes the magic:
  • We will use jquery’s Ajax calls to get a JSON object from the API
  • First we will tidy up the response using turf.js
  • We will add them to the map
  • We will need some color magic

Calling the OpenRouteService.org API

Calling the URL is quite simple as you can see on the swaggerhub page. In the very basic these are a few lines in HTML/Javascript. The example shows the isochrone URL with a static coordinate pair and some other static values. Please make sure to get your own API key!
<script src="https://code.jquery.com/jquery-1.11.1.min.js"></script>
function getAccess(e){
    $.ajax({
        type: "GET", //rest Type
        dataType: 'json',
        url: "https://api.openrouteservice.org/isochrones?locations=-1.1428,52.955&profile=driving-car&range_type=time&interval=300&range=1800&units=&location_type=start&intersections=false&api_key=58d904a497c67e00015b45fc90fa91f0d345426145bb09e67e859771",
        async: false,
        contentType: "application/json; charset=utf-8",
        success: function (data) {
            console.log(data);
        }
    });
}
Now we would like to create a more dynamic way by handing over the coordinates of desire to the function. At the very moment the function has an event object as input. This objects holds all necessary information:
point = e.relatedTarget.feature.geometry.coordinates;
As another needed step we will add the response to the map instead of writing it to the log and remove maybe old entries from the map:
map.eachLayer(function (layer) {
    if (layer.id === 'access'){// it's the access layer
        map.removeLayer(layer);
    } 
});
access = new L.geoJson(data).addTo(map);
access.id="access";
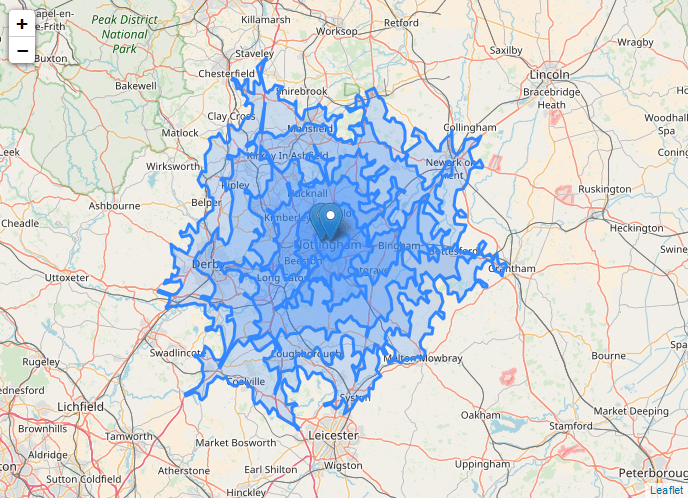
Now the marker is surrounded by a nice looking polygon feature:
Isochrones from the OpenRouteService API
But we see some major problems:
  1. The polygons are overlapping each other.
  2. The color needs adjustment to differentiate each polygon.

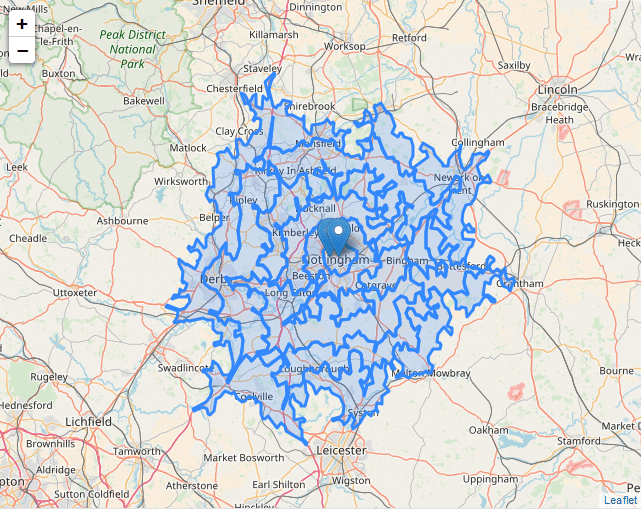
Better Polygons from the OpenRouteService API

In the next step we will enhance the result. Therefore we will create a difference polygon by subtracting the smaller polygons from the bigger ones in a loop. Therefore I am using the turf.js Javascript library and the difference function, which is quite fast:
var difference=[];
for (i=0; i<(data.features.length-1); i++){
        difference.push(turf.difference(data.features[i+1],data.features[i]));
}
difference.push(data.features[0]);
data.features=difference;
The result looks like this:
Difference polygons from the OpenRouteService API
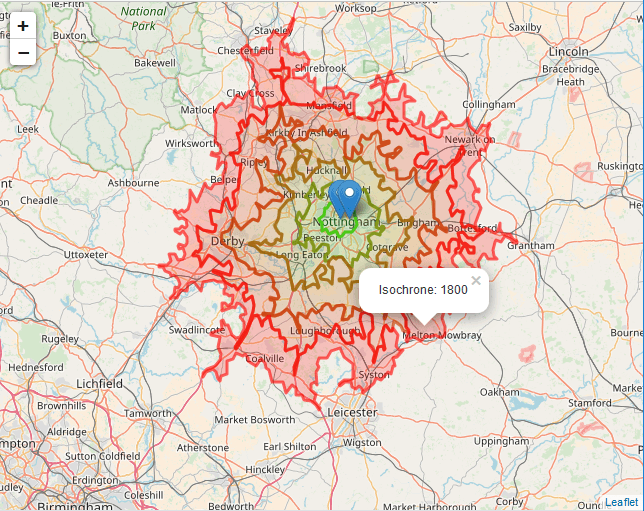
But still, the color scheme does not respect any travel times ( I was using 5min intervals for a maximum of 30min). To do so, I will need a rgb calculation based on the ratio of the time value compared to the maximal value of 30min. Instead of using the default style, we will use a style function:
style: function(feature) {
	inputValues=getInputValues();
	ratio=feature.properties.value/inputValues[4];
	return {color :"rgb(" +String(Math.round(255*ratio)) + "," + String(Math.round(255*(1-ratio)))+ ", 0)",
		opacity: 0.75,
		linewidth:1
	};
}
With this enhancement the overall look is much better:
colored polygons from the OpenRouteService API
These are the main ingredients at the moment.

Getting Isochrones from the map without a marker

The above steps took the marker geometry as inputs. The work with a map and it’s coordinate is quite similar: Instead of asking for the feature geometry the event from the map has a direct object called latlng:
point = e.latlng;
But instead of writing the whole function again we will simply create a different function with the main functionality that is called either from the map event or the marker event. The whole code loks like this in the end:
<html>
	<head>
		<title>A fullscreen ORS webmap</title>
		<meta charset="utf-8" />
        <link rel="stylesheet" href="https://cdnjs.cloudflare.com/ajax/libs/leaflet/1.2.0/leaflet.css"  />
        <link rel="stylesheet" href="https://cdnjs.cloudflare.com/ajax/libs/leaflet-contextmenu/1.4.0/leaflet.contextmenu.css" />
        <script src="https://cdnjs.cloudflare.com/ajax/libs/leaflet/1.2.0/leaflet.js"></script>
        <script src="https://cdnjs.cloudflare.com/ajax/libs/leaflet-contextmenu/1.4.0/leaflet.contextmenu.js"></script>
    	<script src="https://code.jquery.com/jquery-1.11.1.min.js"></script>
        <script src='https://npmcdn.com/@turf/turf/turf.min.js'></script>
        <style>
            body {
                padding: 0;
                margin: 0;
            }
            html, body, #map {
                height: 100%;
                width: 100%;
            }
        </style>
    </head>
    <body>
		<div id="map"></div>
        <script>
             var map = L.map('map',{
                contextmenu: true,
                contextmenuWidth: 140,
                contextmenuItems: [
                    {
                        text: 'get Isochrones',
                        callback: getAccess
                    }
                ]
            }).setView([53, -1], 10);
            L.tileLayer('https://{s}.tile.openstreetmap.org/{z}/{x}/{y}.png', {
                maxZoom: 18
            }).addTo(map);
            //the geojson data:
            var data = {
                "type": "FeatureCollection",
                "features": [
                    {
                        "type": "Feature",
                        "properties": {
                            "name": "Pub"
                        },
                        "geometry": {
                            "type": "Point",
                            "coordinates": [
                                -1.1669,
                                52.956
                            ]
                        }
                    },
                    {
                        "type": "Feature",
                        "properties": {
                            "name": "Pub New"
                        },
                        "geometry": {
                            "type": "Point",
                            "coordinates": [
                                -1.1428,
                                52.955
                            ]
                        }
                    }
                ]
            }
            function onEachMarker(feature, layer){
                layer.bindContextMenu({
                    contextmenu: true,
                    contextmenuWidth: 140,
                    contextmenuItems: [
                        {
                            text: 'get Isochrones from marker',
                            callback: getAccessFromMarker
                        }
                    ]
                })
                layer.bindPopup(feature.properties.name);  
            };
            var markers = L.geoJSON(data, {
                onEachFeature: onEachMarker
            }).addTo(map);
            function getAccessFromMarker(e){
                getIsochrones(e.relatedTarget.feature.geometry.coordinates);
            }
            function getAccess(e){
                getIsochrones([e.latlng.lng,e.latlng.lat]);
            }
            function getIsochrones(point){
                $.ajax({
                    type: "GET", //rest Type
                    dataType: 'json',
                    url: "https://api.openrouteservice.org/isochrones?locations=" + String(point[0]) + "," + String(point[1]) +"&profile=driving-car&range_type=time&interval=300&range=1800&units=&location_type=start&intersections=false&api_key=58d904a497c67e00015b45fc90fa91f0d345426145bb09e67e859771",
                    async: false,
                    contentType: "application/json; charset=utf-8",
                    success: function (data) {
                        map.eachLayer(function (layer) {
                            if (layer.id === 'access'){// it's the access layer
                                map.removeLayer(layer);
                            } 
                        });
                        var difference=[];
                        for (i=0; i<(data.features.length-1); i++){
                            console.log(i);
                            difference.push(turf.difference(data.features[i+1],data.features[i]));
                        }
                        difference.push(data.features[0]);
				        data.features=difference;
                        access = new L.geoJson(data,{
                            onEachFeature: function(feature,layer){
                                layer.bindPopup("Isochrone: " + feature.properties.value);
                            },
                            style: function(feature) {
                                ratio=feature.properties.value/1800;
                                return {color :"rgb(" + String(Math.round(255*ratio)) + "," + String(Math.round(255*(1-ratio)))+ ", 0)",
                                opacity: 0.6};
                            }
                        }).addTo(map);
                        access.id="access";
                    }
                });
            }
            </script>
    </body>
</html>
Enjoy the webmap here:
5 2 votes
Article Rating
Subscribe
Notify of
guest

This site uses Akismet to reduce spam. Learn how your comment data is processed.

3 Comments
Oldest
Newest Most Voted
Inline Feedbacks
View all comments
Nils Nolde
Nils Nolde
6 years ago

Great example, David! Thanks for the easy-to-follow instructions to use ORS:) You mind posting your Twitter handle for proper attribution?

Sam
Sam
3 years ago

This is a fantastic tutorial – however looks like the ORS API it consumes has changed recently and now a CORS issue is present in the browser devtools, so it fails to retrieve the data now.

Is this something you could adjust easily, I’ve been trying things on my version and I’m wondering if ORS have caused it to break?

Riccardo
Admin
3 years ago
Reply to  Sam

Yes, but it looks like they just changed the URL and moved away from GET requests towards POST only.