1. route360
Route360 is a Germany based “startup” which was founded somehow a year ago as a spin-off of the HPI provides an API to their accessibility analytics engine. I personally met their founder on a pitch for big car manufacturer this year. Once you register you can use the free account and do up to 5000 requests per month which is quite a lot. You simply pass over a pair of lat/lng and intervals to their server (maybe along with some POIs which you need to see whether they fit in your desired time slice). You will get back a nicely styled set of polygons.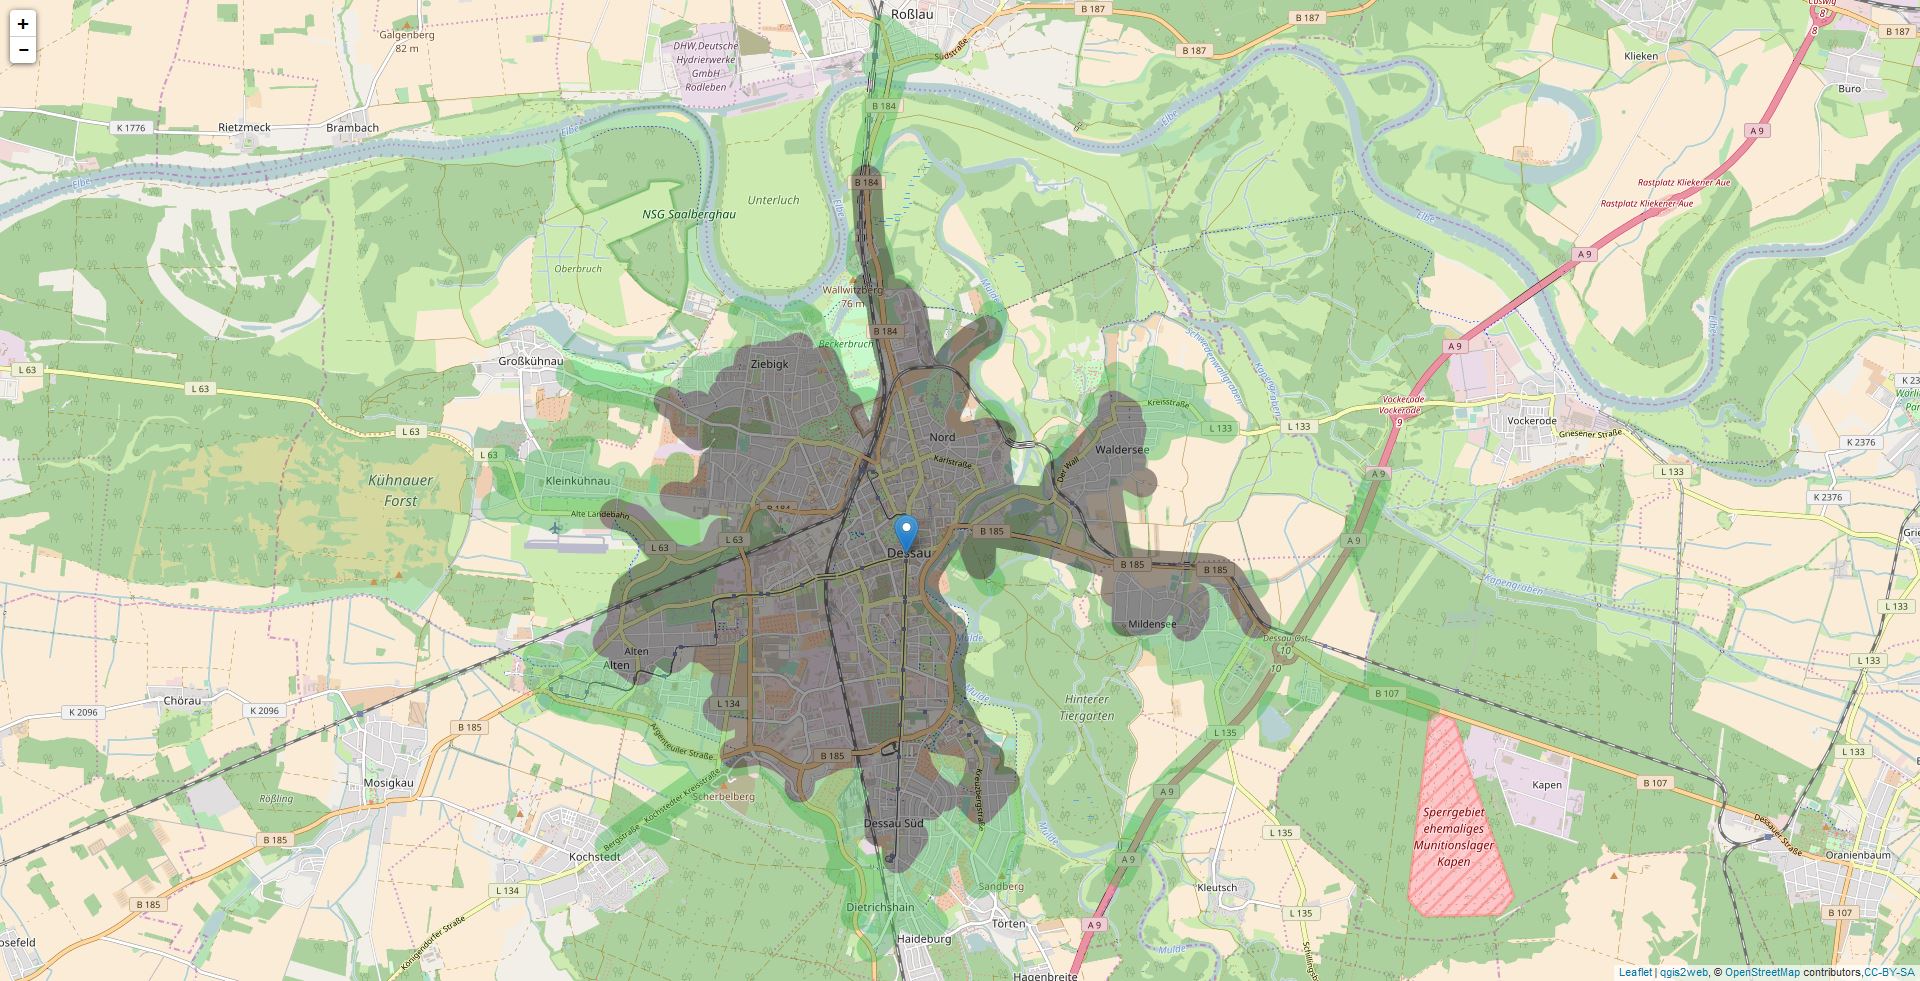
<!doctype html>
<html lang="en">
<head>
<script src="https://cdnjs.cloudflare.com/ajax/libs/leaflet/1.0.2/leaflet.js"></script>
<link rel="stylesheet" href="https://cdnjs.cloudflare.com/ajax/libs/leaflet/1.0.2/leaflet.css" />
<script src="https://cdnjs.cloudflare.com/ajax/libs/jquery/2.1.3/jquery.min.js"></script>
<script src="https://cdnjs.cloudflare.com/ajax/libs/underscore.js/1.8.2/underscore-min.js"></script>
<script src="https://apps.route360.net/releases/r360-js/latest.js"></script>
<style>
html, body {
width: 100%;
height: 100%;}
#map {
width: 100%;
height: 100%;}
</style>
</head>
<body>
<div id="map"></div>
<script>
var map = L.map('map', {
zoomControl:true, maxZoom:14, minZoom:1
}).fitBounds([[50.7092032631,10.81902755],[51.2451127369,11.72095445]]);
map.attributionControl.addAttribution('<a href="https://github.com/tomchadwin/qgis2web" target="_blank">qgis2web</a>');
var basemap0 = L.tileLayer('http://{s}.tile.openstreetmap.org/{z}/{x}/{y}.png', {
attribution: '© <a href="http://openstreetmap.org">OpenStreetMap</a> contributors,<a href="http://creativecommons.org/licenses/by-sa/2.0/">CC-BY-SA</a>',
maxZoom: 14
});
basemap0.addTo(map);
r360.config.serviceKey = 'HCT1BRC7Q6G8FCLY4PHU';
r360.config.serviceUrl = 'https://service.route360.net/germany/';
var polygonLayer = r360.leafletPolygonLayer().addTo(map);
var travelOptions = r360.travelOptions();
travelOptions.setTravelTimes([120, 240, 360, 480, 600]); // we want to have polygons for 5 to 30 minutes
travelOptions.setTravelType('car');
function onMapClick(e) {
alert("You clicked the map at " + e.latlng);
var marker = L.marker((e.latlng)).addTo(map);
travelOptions.addSource(marker);
r360.PolygonService.getTravelTimePolygons(travelOptions, function(polygons){
// add the returned polygons to the polygon layer
// and zoom the map to fit the polygons perfectly
polygonLayer.setColors([{
'time': 120,
'color': '#33CC00'
}, {
'time': 240,
'color': '#669900'
}, {
'time': 360,
'color': '#996600'
}, {
'time': 480,
'color': '#CC3300'
}, {
'time': 600,
'color': '#FF0000'
} ]);
polygonLayer.clearAndAddLayers(polygons, true);
});
}
map.on('click', onMapClick);
</script>
</body>
</html>
Once you see the map, simply click on a point and the corresponding polygons will be drawn.
The app itself is very fast as there is no parsing involved and the rich API provides a lot of interactivity. definitely worth a try. The only downside with this service: Each region on the earth has its own serviceUrl. But as I have talked to Henning (the founder), they are working on a worldwide system already. Furthermore it does not seems to work with Leaflet 1.0.2!Here is an embedded version:
2. OpenRouteService
Openrouteservice might already known to you as I used this routing engine already in the OSMroute plugin. So I decided to alter the code a bit to make it work in leaflet-based webmap as well. The great advantage: The usage is for free but you are limited to “1000 requests per hour” which is the same as approx 720.000 requests per month. That’s fcuking much! Furthermore the service has actually no limitation on region so you could try it on every spot on this beloved planet as long as the OSM project has some “good” data for it. Unfortunately the API responds with a xml which is not the best candidate to be shown on a leaflet map. So you need to do some client-sided parsing but this seems to be fast enough. The bottleneck still is the API which needs about 5-10 secs to give you a result for 10min / 2min isochrones.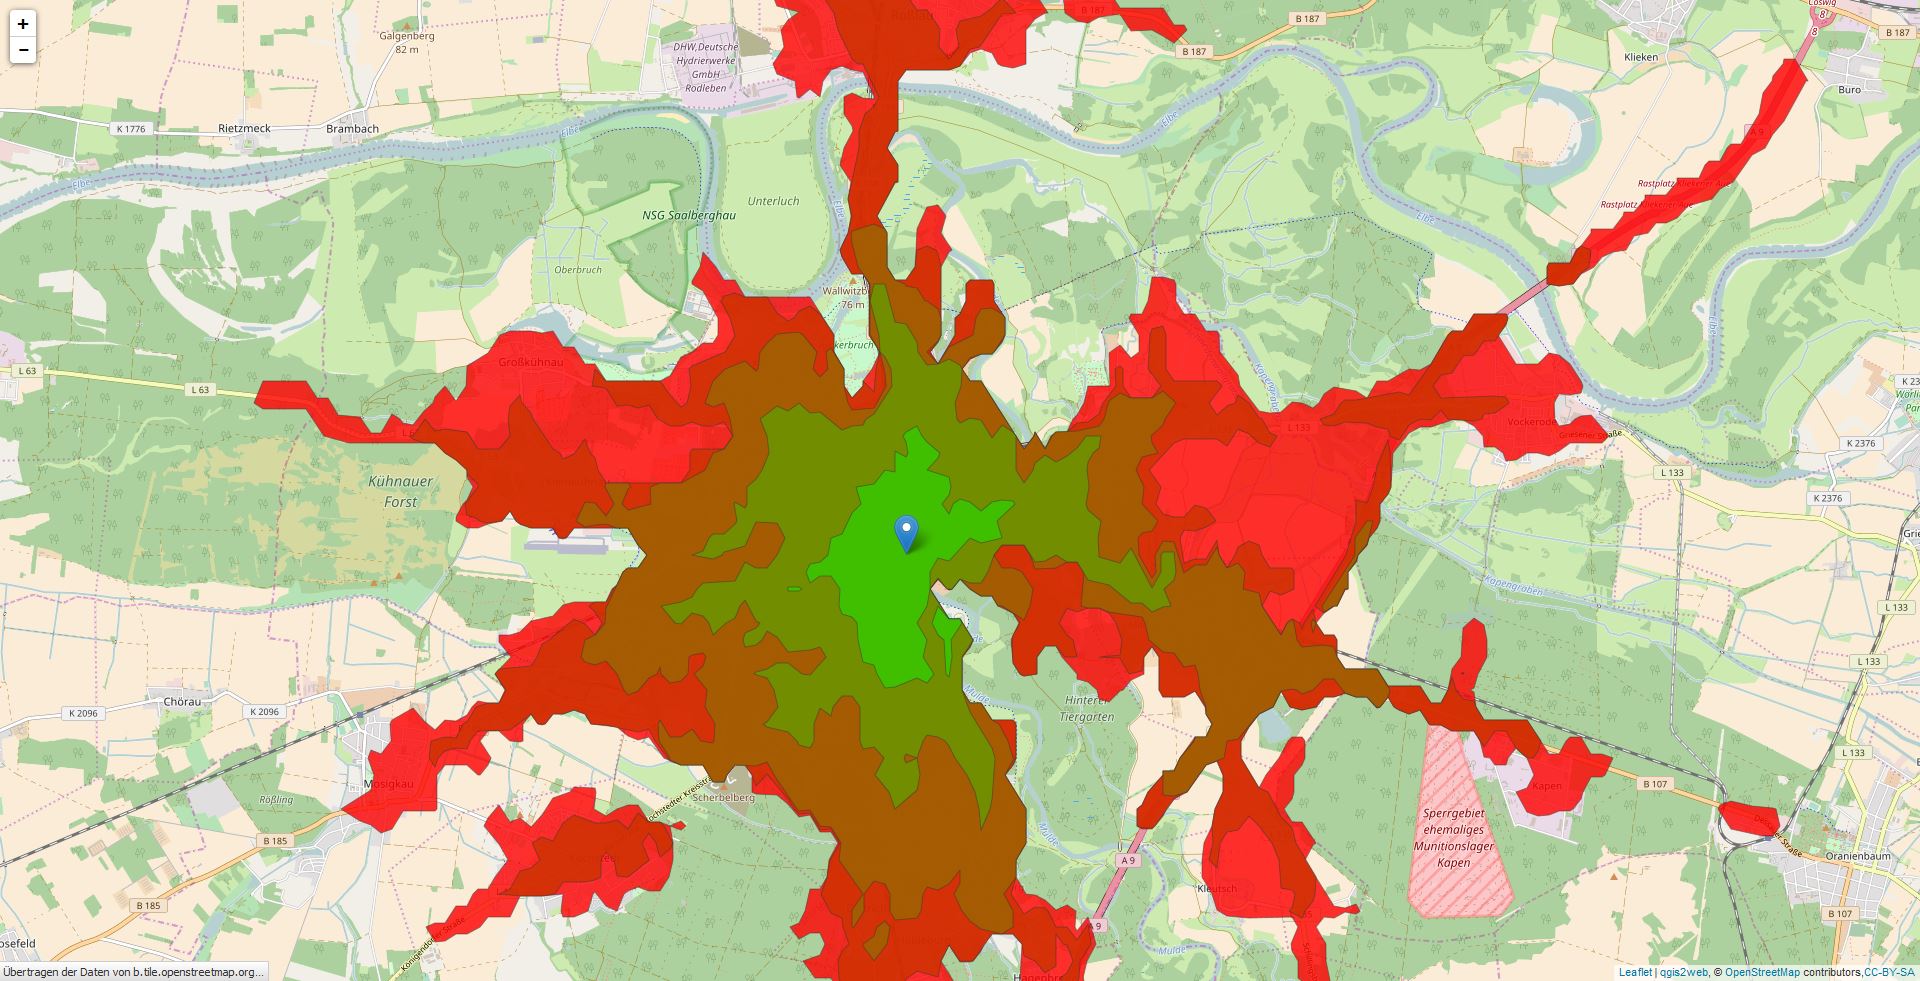
<!doctype html>
<html lang="en">
<head>
<meta charset="utf-8">
<link rel="stylesheet" href="https://cdnjs.cloudflare.com/ajax/libs/leaflet/0.7.7/leaflet.css" />
<script src='https://cdnjs.cloudflare.com/ajax/libs/jquery/2.1.3/jquery.min.js'></script>
<script type="text/javascript" src="view-source:http://www.openrouteservice.org/js/namespaces.js"></script>
<script src='js/xml2json.js'></script>
<script src='https://cdnjs.cloudflare.com/ajax/libs/leaflet/0.7.7/leaflet.js'></script>
<script type="text/javascript" src="js/spin.min.js"></script>
<script type="text/javascript" src="js/leaflet.spin.min.js"></script>
<style>
body {
padding: 0;
margin: 0;
}
html, body, #map {
height: 100%;
width: 100%;
}
</style>
<title></title>
</head>
<body>
<div id="map">
</div>
<script>
var map = L.map('map', {
zoomControl:true, maxZoom:14, minZoom:1
}).fitBounds([[50.7092032631,10.81902755],[51.2451127369,11.72095445]]);
map.attributionControl.addAttribution('<a href="https://github.com/tomchadwin/qgis2web" target="_blank">qgis2web</a>');
var basemap0 = L.tileLayer('http://{s}.tile.openstreetmap.org/{z}/{x}/{y}.png', {
attribution: '© <a href="http://openstreetmap.org">OpenStreetMap</a> contributors,<a href="http://creativecommons.org/licenses/by-sa/2.0/">CC-BY-SA</a>',
maxZoom: 14
});
basemap0.addTo(map);
//create
function onEachFeature(feature, layer) {
// does this feature have a property named popupContent?
if (feature.properties) {
layer.bindPopup("Time: " + feature.properties.time + "<hr>Area: " + feature.properties.area);
}
}
url="http://openls.geog.uni-heidelberg.de/analysis?api_key=e2017639f5e987e6dc1f5f69a66d049c";
var json;
var geojson = {};
geojson['type'] = 'FeatureCollection';
function onMapClick(e) {
alert("You clicked the map at " + e.latlng);
map.spin(true);
text='<?xml version="1.0" encoding="UTF-8" ?><aas:AAS version="1.0" xmlns:aas="http://www.geoinform.fh-mainz.de/aas" xmlns:xsi="http://www.w3.org/2001/XMLSchema-instance" xsi:schemaLocation="http://www.geoinform.fh-mainz.de/aas"><aas:RequestHeader></aas:RequestHeader><aas:Request methodName="AccessibilityRequest" version="1.0" requestID="00"><aas:DetermineAccessibilityRequest><aas:Accessibility><aas:AccessibilityPreference><aas:Time Duration="PT0H10M00S" /></aas:AccessibilityPreference><aas:AccessibilitySettings><aas:RoutePreference>Car</aas:RoutePreference><aas:Method>RecursiveGrid</aas:Method><aas:Interval>120</aas:Interval></aas:AccessibilitySettings><aas:LocationPoint><aas:Position><gml:Point xmlns:gml="http://www.opengis.net/gml" srsName="EPSG:4326"><gml:pos>' + String(e.latlng.lng).replace(',','.') + ' '+ String(e.latlng.lat).replace(',','.') + '</gml:pos></gml:Point></aas:Position></aas:LocationPoint></aas:Accessibility><aas:AccessibilityGeometryRequest><aas:PolygonPreference>Detailed</aas:PolygonPreference></aas:AccessibilityGeometryRequest></aas:DetermineAccessibilityRequest></aas:Request></aas:AAS>';
$.ajax({
type: "POST",
data: text,
url: url,
jsonp: "callback",
dataType: "xml",
success: function(xml){
//bounds = parseResultsToBounds(xml);
//polygons = parseResultsToPolygon(xml);
var marker = L.marker((e.latlng)).addTo(map);
json=xml2json(xml);
json=json.replace("\n","");
json=json.replace("undefined","");
json=JSON.parse(json);
//now we need to iterate over the json to build a geoJSON
geojson['features'] = [];
for (var polygon=json["aas:AAS"]["aas:Response"]["aas:AccessibilityResponse"]["aas:AccessibilityGeometry"]["aas:Isochrone"].length-1; polygon>=0; polygon--){
coordinateCollection = [];
for (vertex in json["aas:AAS"]["aas:Response"]["aas:AccessibilityResponse"]["aas:AccessibilityGeometry"]["aas:Isochrone"][polygon]["aas:IsochroneGeometry"]["gml:Polygon"]["gml:exterior"]["gml:LinearRing"]["gml:pos"]){
coordinateCollection.push([parseFloat(json["aas:AAS"]["aas:Response"]["aas:AccessibilityResponse"]["aas:AccessibilityGeometry"]["aas:Isochrone"][polygon]["aas:IsochroneGeometry"]["gml:Polygon"]["gml:exterior"]["gml:LinearRing"]["gml:pos"][vertex].split(" ")[0]),parseFloat(json["aas:AAS"]["aas:Response"]["aas:AccessibilityResponse"]["aas:AccessibilityGeometry"]["aas:Isochrone"][polygon]["aas:IsochroneGeometry"]["gml:Polygon"]["gml:exterior"]["gml:LinearRing"]["gml:pos"][vertex].split(" ")[1])]);
}
newFeature = {
"type": "Feature",
"geometry": {
"type": "Polygon",
"coordinates": [coordinateCollection]
},
"properties": {
"area": json["aas:AAS"]["aas:Response"]["aas:AccessibilityResponse"]["aas:AccessibilityGeometry"]["aas:Isochrone"][polygon]["aas:IsochroneGeometry"]["@area"],
"time":json["aas:AAS"]["aas:Response"]["aas:AccessibilityResponse"]["aas:AccessibilityGeometry"]["aas:Isochrone"][polygon]["@time"]
}
}
geojson['features'].push(newFeature);
//as we do have the xml we can run some functions to parse them to geojson and put them on the map
}
areas = L.geoJson(geojson, {
style: function(feature) {
val=parseInt(feature.properties.time)/600;
rgb=[Math.floor((255 * val) / 1), Math.floor((255 * (1 - val)) / 1),0]
return {
fillColor: "rgb("+rgb.join(",")+")",
color: '#333333',
weight: 1,
fillOpacity: 0.8
}
},
onEachFeature: onEachFeature
});
areas.addTo(map);
map.spin(false);
}
})
}
map.on('click', onMapClick);
</script>
</body>
</html>
Once the ajax call receives an answer I parse it into my geojson and I alter the style according to the time intervals from green to red. The coding is not so short as with the route360 API but you can use the newest leaflet 1.0.2 version.
As it is a opensource project I really encourage you to work with them. But if you need a reliable and fast response you should probably go with another service or talk with them to get your own hosted version.Here is an embedded version:
iso4APP
iso4APP is quite new to me. The Italian based startup is quite comparable with route360 but in my eyes not as powerful when it comes to the API. The pricing is comparable to the route360 prices: 5000 request for free, beyond this you will need to buy some credits. To get a price for the credits you need to ask for a quotation…not quite transparent.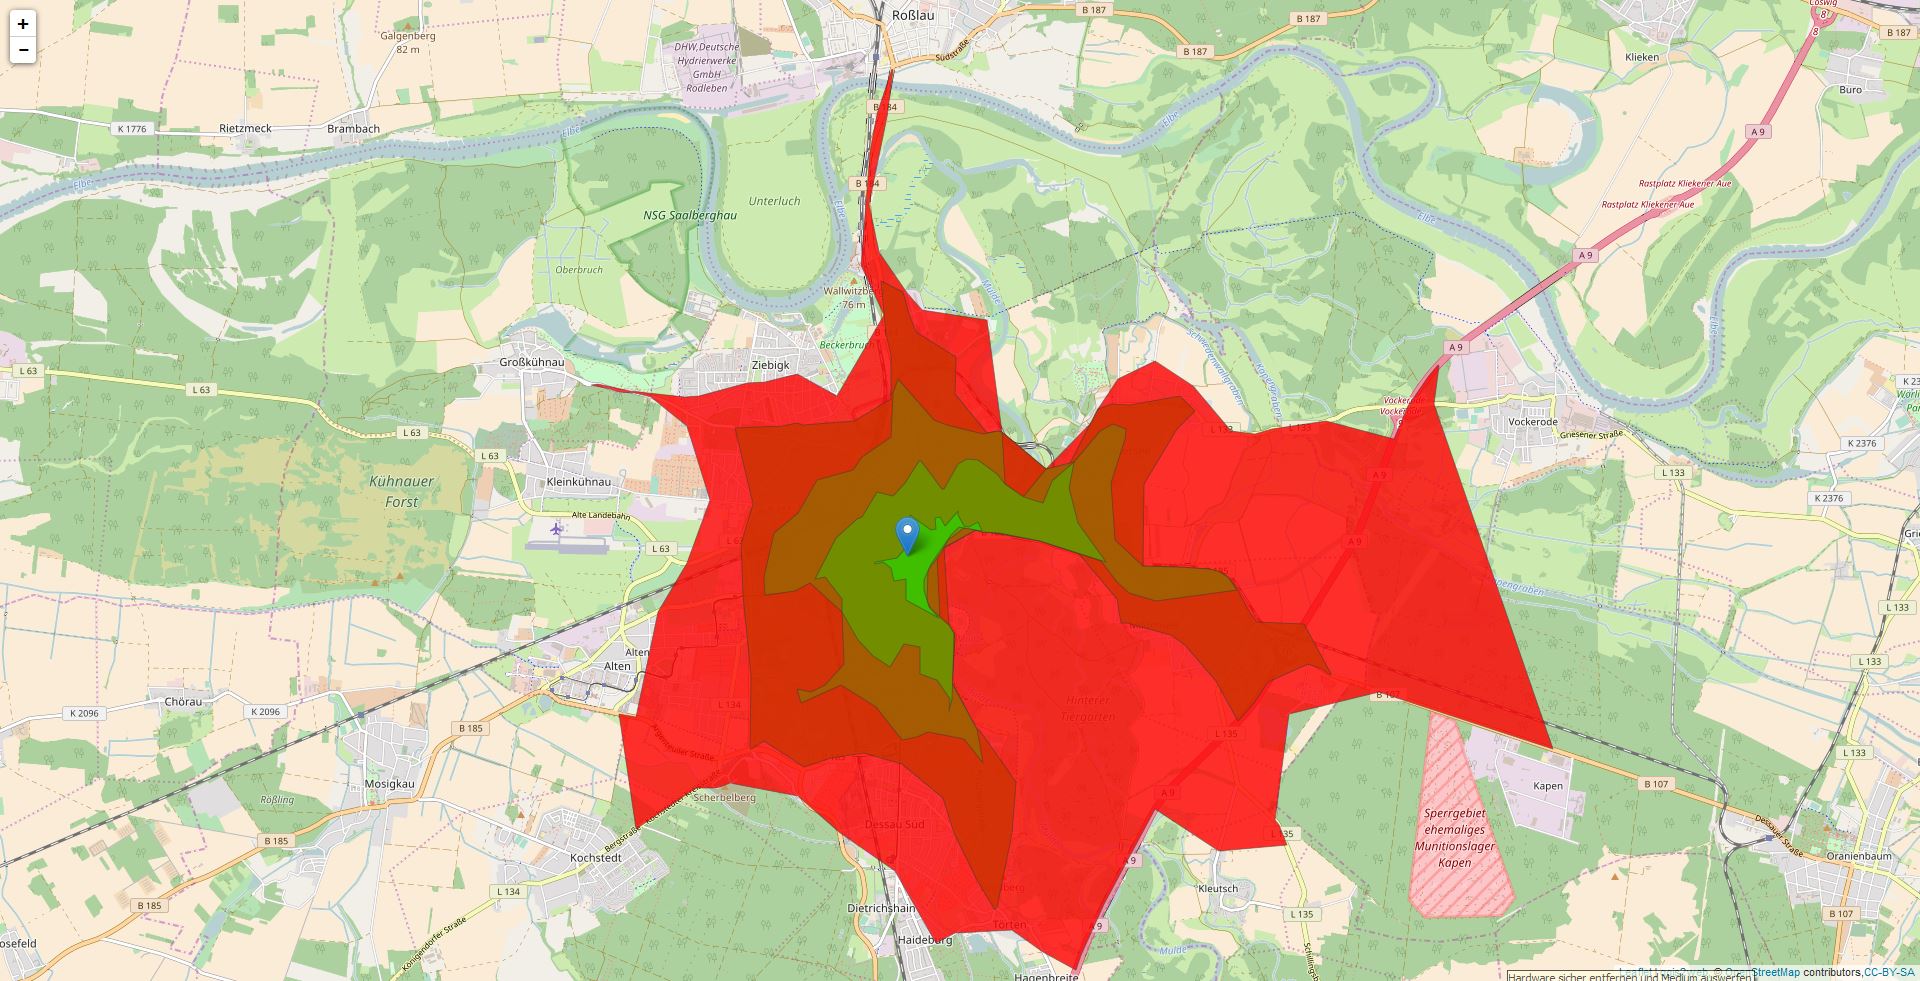
<!doctype html>
<html lang="en">
<head>
<meta charset="utf-8">
<link rel="stylesheet" href="https://cdnjs.cloudflare.com/ajax/libs/leaflet/0.7.7/leaflet.css" />
<!--link rel='stylesheet prefetch' href='https://developers.route360.net/download/basic-example/jquery-ui-1.10.0.custom.css'-->
<script src='https://cdnjs.cloudflare.com/ajax/libs/jquery/2.1.3/jquery.min.js'></script>
<script src='https://cdnjs.cloudflare.com/ajax/libs/leaflet/0.7.7/leaflet.js'></script>
<script src="http://www.iso4app.net/api/js?v=1.3&lkey=87B7FB96-83DA-4FBD-A312-7822B96BB143"></script>
<style>
body {
padding: 0;
margin: 0;
}
html, body, #map {
height: 100%;
width: 100%;
}
</style>
<title></title>
</head>
<body>
<div id="map">
</div>
<!--script src="data/json_sampledata0.js"></script-->
<script>
var map = L.map('map', {
zoomControl:true, maxZoom:14, minZoom:1
}).fitBounds([[50.7092032631,10.81902755],[51.2451127369,11.72095445]]);
map.attributionControl.addAttribution('<a href="https://github.com/tomchadwin/qgis2web" target="_blank">qgis2web</a>');
var basemap0 = L.tileLayer('http://{s}.tile.openstreetmap.org/{z}/{x}/{y}.png', {
attribution: '© <a href="http://openstreetmap.org">OpenStreetMap</a> contributors,<a href="http://creativecommons.org/licenses/by-sa/2.0/">CC-BY-SA</a>',
maxZoom: 14
});
basemap0.addTo(map);
//create
function onEachFeature(feature, layer) {
// does this feature have a property named popupContent?
if (feature.properties) {
layer.bindPopup("Time: " + feature.properties.time + "<hr>Area: " + feature.properties.area);
}
}
var isoEngine = new iso4app.Engine();
function onMapClick(e) {
//bounds = parseResultsToBounds(xml);
//polygons = parseResultsToPolygon(xml);
var marker = L.marker((e.latlng)).addTo(map);
console.log(marker);
marker2 = [46.0463697, 14.5009232];
intervalls = [iso4app.Time.SECONDS_120,iso4app.Time.SECONDS_240,iso4app.Time.SECONDS_360,iso4app.Time.SECONDS_480,iso4app.Time.SECONDS_600];
props = { maxdist : "100", mobility : iso4app.Mobility.MOTOR_VEHICLE, speedtype : iso4app.Speed.NORMAL, maxvehiclespeed : 150, reducequeue : "0", avoidtollways : "0", concavity : iso4app.Concavity.LEVEL_7 }
isoline = isoEngine.getIsoline(marker._latlng.lat,marker._latlng.lng,iso4app.Time.SECONDS_600,props);
if (isoline.errcode=="0"){
//service responds without error
// draw isodistance polygon
var polyCoords = Array(), coord, polygon, isocoords = isoline.isocoords.split(",");
for(j = 0; j < isocoords.length; j++){
coord = (isocoords[j]+"").trim().split(" ");
polyCoords[j] = L.latLng((coord[0]+" ").trim(),(coord[1]+" ").trim());
}
polygon = L.polygon(polyCoords,{color: "#0066cc",fillOpacity:.2,weight:2});
map.addLayer(polygon);
// draw a marker on start point returned by the service
var startPoint = isoline.startpoint.split(" ");
L.marker(startPoint).addTo(map)
.bindPopup('10min Isochrone<br/>'+isoline.startpoint);
} else {
//print error message on console
console.log(isoline.errcode+":"+isoline.errmsg);
}
}
map.on('click', onMapClick);
</script>
</body>
</html>
As you can see, you also need to do the styling by yourself. Furthermore you need to run this file on a local server. It will not work from HDD only. Still a very fast solution which worked without an issue in Russia, USA and Germany but failed in Mongolia and India. Here is the list of supported countries (66 at the moment).Here is an embedded version:
Hey – I noticed you missed out the TravelTime API for isochrones – take a look here http://www.traveltimeplatform.com/developers-traveltime-api-documentation/