Today I’ll start with a new series of tutorials for an open Source GIS called “ILWIS GIS“.
ILWIS is the short term for “Integrated Land and Water Information System” developed at the ITC Enschede and distributed under the GNU General public license as open Source GIS since 2007. It’s purposes is designed for geoecological questions. It can handle both, vector- and rasterdata.
If you’re interessted in ILWIS you can download the newest version here: http://52north.org/communities/ilwis/ilwis-open/download. The software package is available for the following operation systems: Windows and with the use of additional software on Linux and Mac OS X.
The language of ILWIS GIS is english. There a lots of portuguese, greek, italian and also persian scientists working on help files and tutorials. If you’re interessted in more information about ILWIS in one of these languages, please clickhere. ILWIS is a great GIS for teaching yourself because there are plenty of detailed tutorials available.
ILWIS has some difference to common GIS like ESRI ArcGIS or QGIS since a direct mapwindow is missing. But no worry, there is the possibility to open the layers in seperate mapwindows and combine them. The mapview reminds me on SAGA GIS. Another big point is the command line. All of the modules and many processes can be opened and definied using commands. So if you’re familiar to commands, it’ll be easy for you to start your desired process and calculations. What I really like in ILWIS GIS is that all your generated geodata will be labeled with the calculations donw/used modules and the parent files. So it’s easy to reproduce your workflow.
At the beginning, ILWIS GIS looks a bit old-fashioned. A smooth user-interface is missing…but let’s start with the opening of the software and some descriptions about the main workspace with some images.
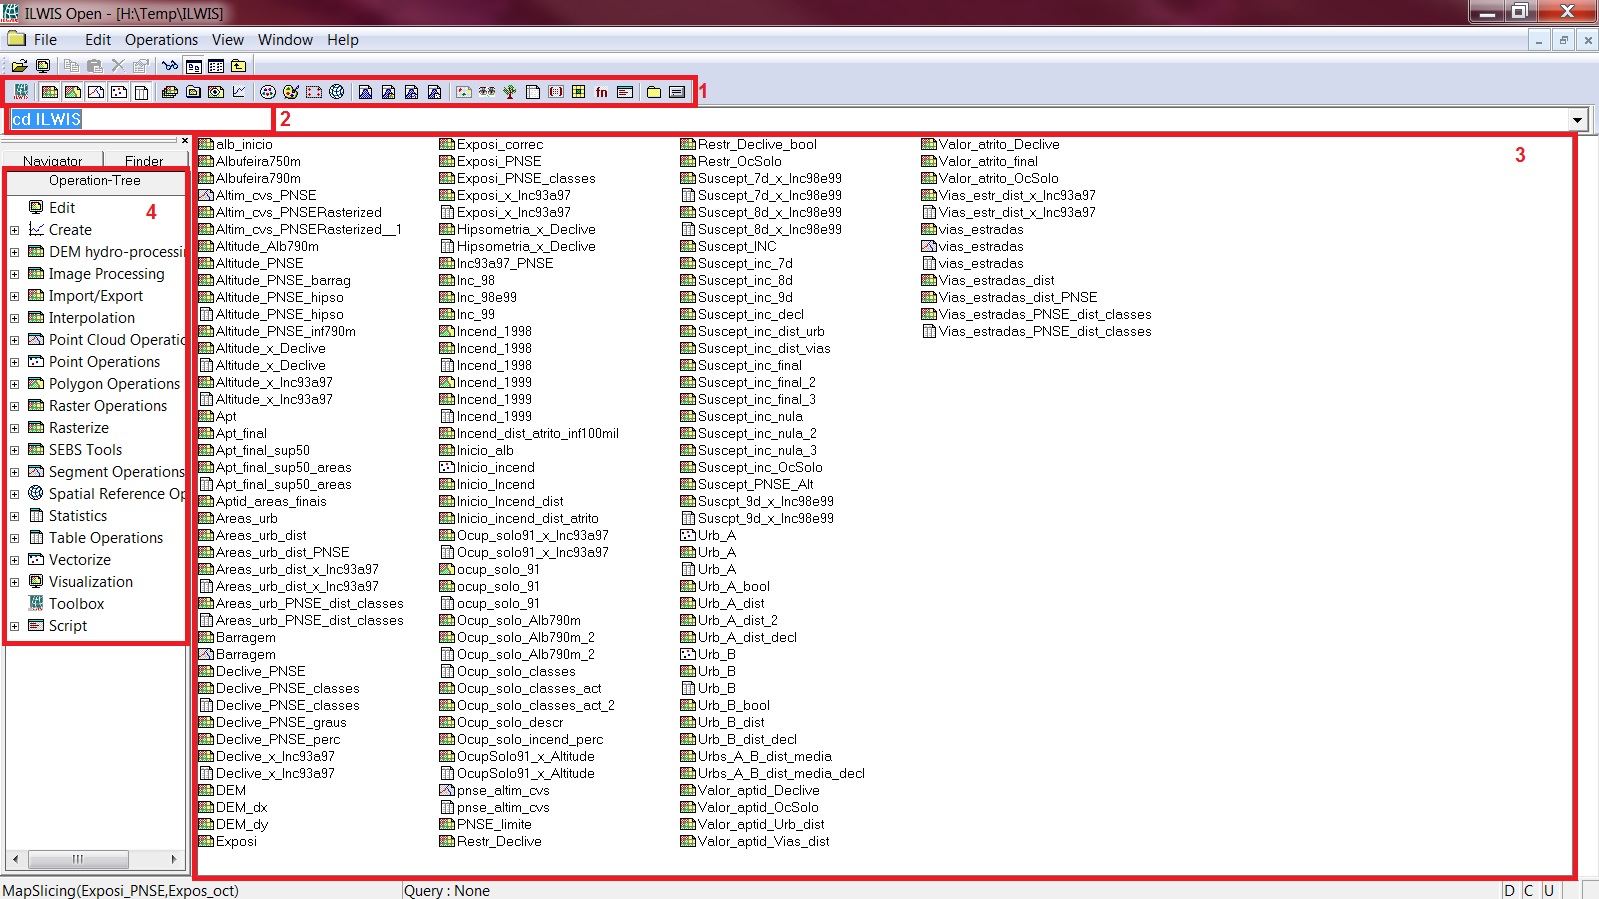
The Screenshot shows you how your ILWIS GIS workspace looks after opening. It’s the main area where you work. The marked area
(1) let you change the visibility of your files in your directory. Right now, there are only 5 selected. These five are (from left to right): raster-, polygon-, segment(polyline)-, point-layer and additional attribute tables. Since ILWIS is a bit different to other GIS it stores domains and represantation in an extra file which can enable here (color palette). There is also the possibility to activate histograms, filters, map lists, etc. In the case that your desired files are not shown in the directory (area (3) your solution will be in this bar.
(2) is the command line. There you can call the modules or make calculations. We will focus on the line in the following tutorials.
(3) is your main workspace and shows you all your files in your directory. Which files you can see depends on the activation in bar (1). Like I have mentioned, ILWIS has a extraordinary way for saving parts of your data. Next to domains and representations there are also files for georeferencing and coordinate systems. It’s a bit tricky at the beginning to get familiar with it.
(4) the heart of ILWIS GIS is represented by the modules. You can either chose your modules in the ‘operation-tree’ (similar to SAGA GIS), search for specific modules using the ‘finder’, typing in a command, rightclick on the file or selecting the modules using the drop-down menu at the top of the screen named ‘Operations’.
Some of these modules will also be part of the next tutorials.
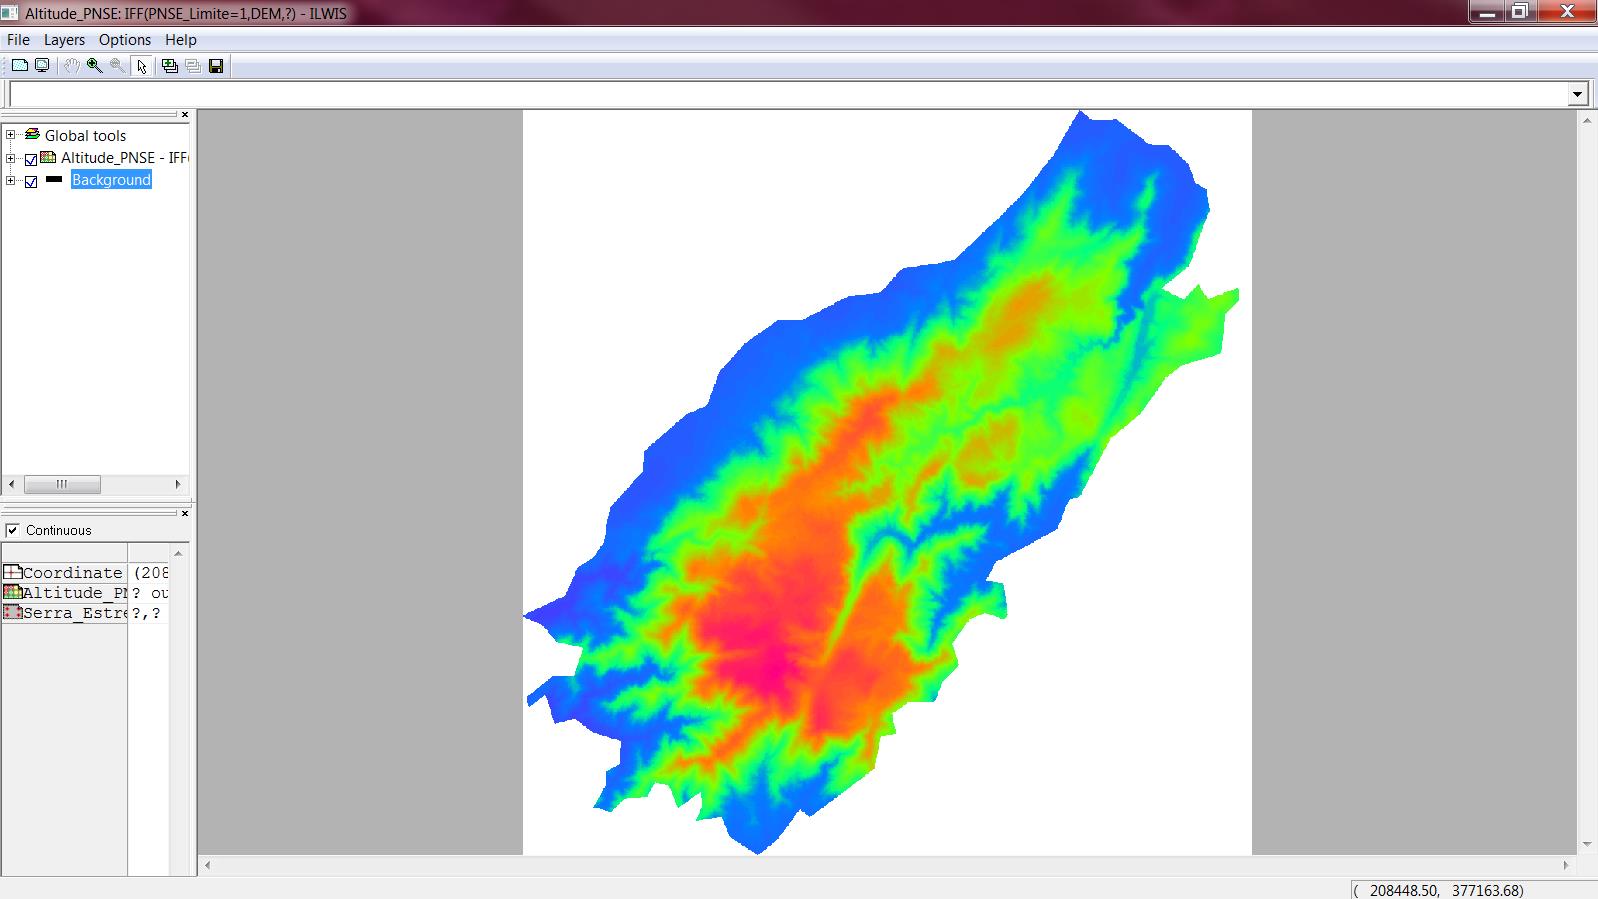
At the end I’ll show you the map-window which opens when you doubleclick to a file.
I hope you enjoyed the first introduction to ILWIS and download it for your first steps.