RasterCalc QGIS Plug-in
QGIS is an open-source geographic information system that is familiar to many geospatial professionals. I find more and more that I’m able to use QGIS for most of my GIS needs and this is in large part due to the great plug-ins that are available. In this post I want to give an overview of one of my favorite plug-ins, RasterCalc.
If you have QGIS installed on your system, you can download RasterCalc from the official plug-in repository, here. After downloading, you can install it in the appropriate location for your system. In my case that is:
$HOME/.qgis/python/plugins,
though this may vary by system.
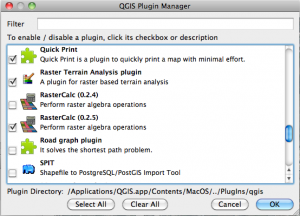
RasterCalc is just what you might imagine it is, a raster band calculator. Once you have it installed properly, it simply needs to be selected under Plugins->Manage Plugins, as below:
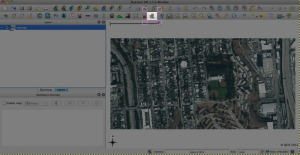
After enabling the plugin, you will now find it in your QGIS toolbar.
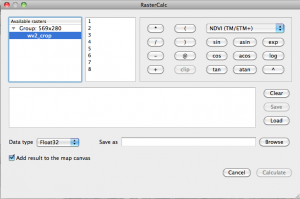
In this case, I’ve loaded some degraded resolution WorldView-2 imagery. These data are 8 bands, spanning from the violet to near-IR. Loading up RasterCalc, we have access to the 8 bands after selecting the image we want to work with:
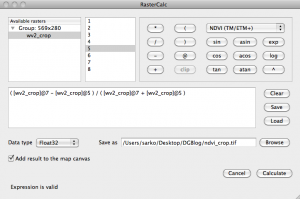
You can see we have access to basic mathematic and trigonometric functions. Additionally we can output the calculated data to a file or drop it into the existing canvas. In this case, I’ll calculate a simple NDVI based on bands 7 and 5.
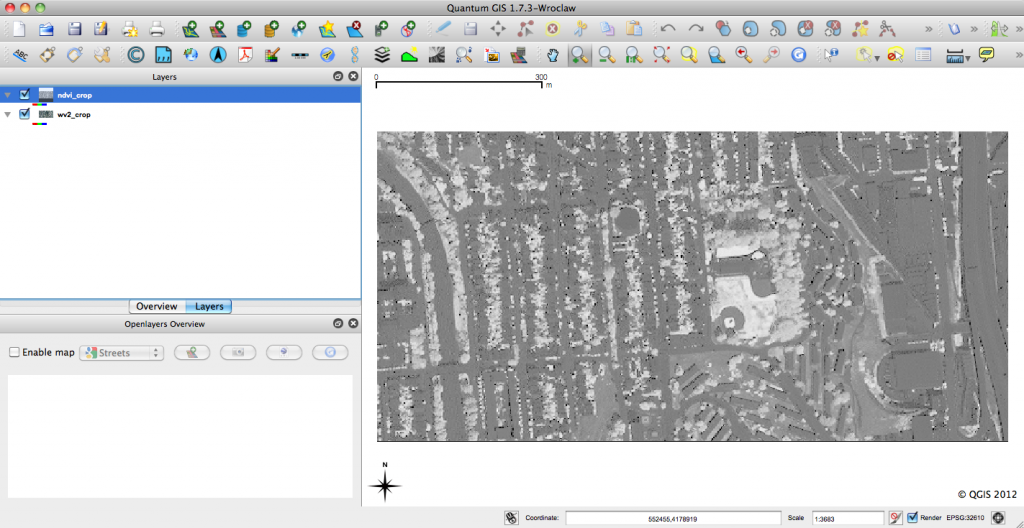
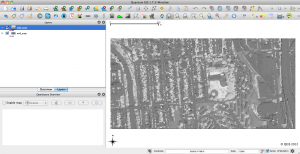
RasterCalc tells you when your expression is valid, just in case you miss a bracket. After generating the equation and checking validity, simply select Calculate and it will generate the data and drop it in the canvas. Below is my NDVI,
I’ve scaled the data and you can clearly see that the trees and grass in the previous true-color image are now represented by high values, as you expect from NDVI. A simple example, but a powerful tool.
Thank you for reading. If you have ideas of other plugins to highlight, please leave a comment.
[…] Click for previous article in this series about RasterCalc […]