The more we work in our special scientific areas and trying to answer often complex questions, we face the problem of the sheer amount of data. Therefore the knowledge about unsupervised classifications, its prior steps and its application in several software packages is the best way to see patterns in your data, extract underlying information or to reduce complexity by using only “relevant” informations of your data. Therefore we use a basic concept: similar things should reflect similar in remote sensed data:
an apple and a pear both belongs to fruits and seems to have similar colors in most cases. Rocks are often as round as apples but are a very different thing. So: Yap, you can compare apples with pears.
Due to the fact that we are able to use GIS-software to get our things done, I would like to share a view on data mining in QGis.
The process itself is a three-step process:
0) create a layer stack to get in-depth knowledge about your working area.
1) determine the center points for the desired numbers of clusters/classes
2) classify each pixel/object according the given location of classes.
So first of all, we will need data to stack our data to get a better insight in where are the things to classify. We will classify the landcover types in the steppe region of Mongolia in the end. Therefore visit this FTP-page and download xxx.b1 to xxx.b5 and xxx.b7.
These files represent surface reflection in the blue, green, red, near infrared, and two bands of middle infrared (band 5 and band 7). Due to the spectral signature of different landcover types we should be able to distinguish forests from steppe, water and other things in a more or less automatic way.
Lets go step by step:
<
ol>
that’s easy 😉
<li>find the tool</li>
that’s a bit more complicated as you may be used to do in ArcGIS or ErdasImagine:
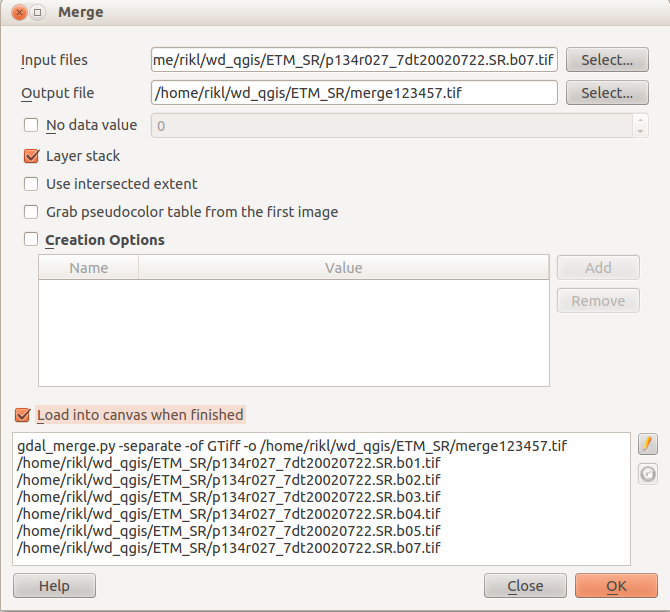
Make sure you can use the following options: Raster -> Miscellaneous -> Merge
If this is not possible, install the GDAL tools.
Now select as input our 6 bands in the correct order and specify the output file with an intelligent name.
<li>adjust the result</li>
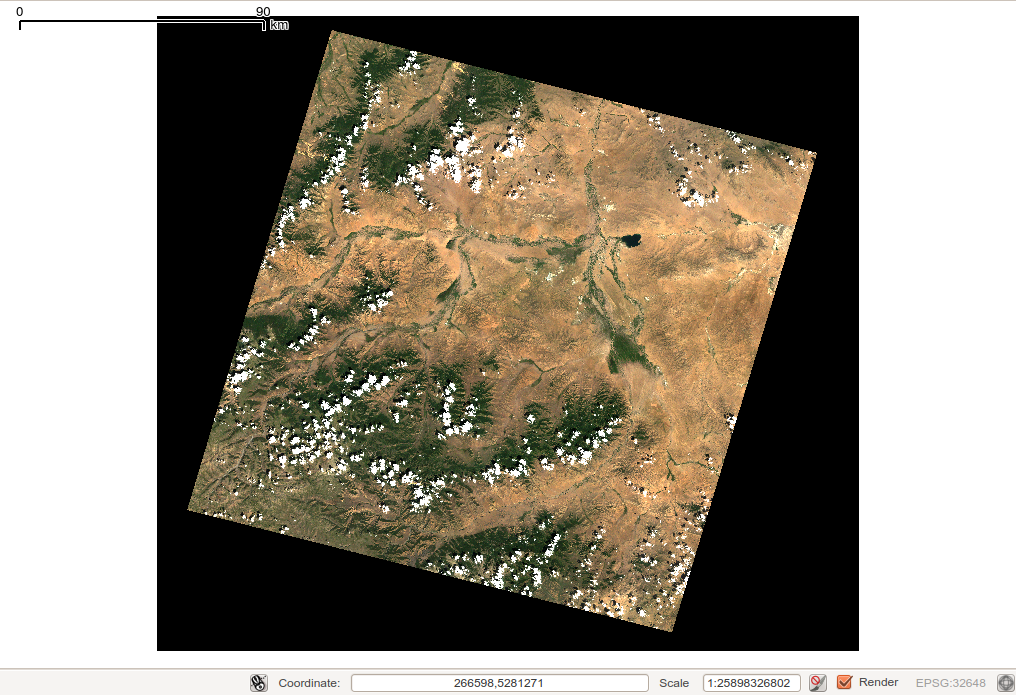
we will come up with a resulting image like this:

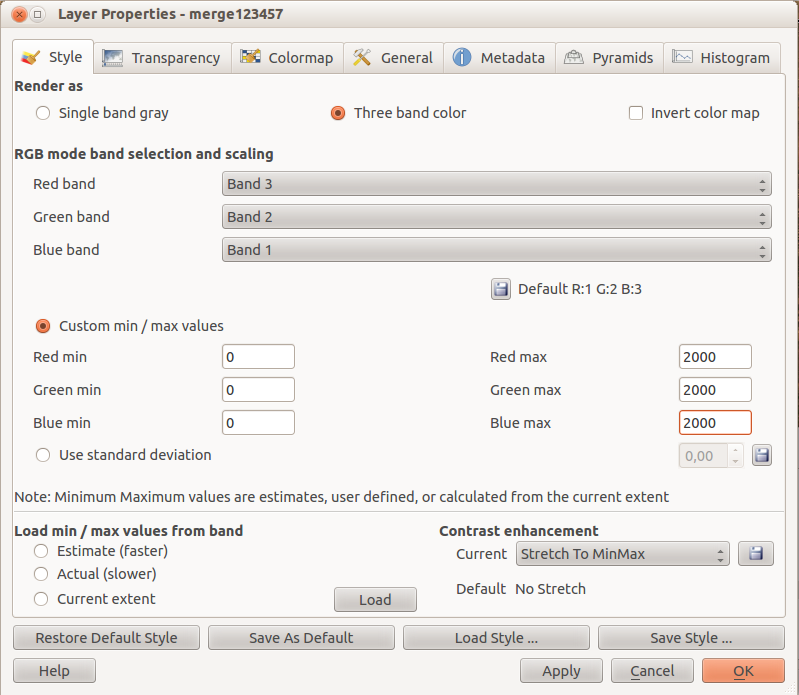
but it isn’t that bad when you enhance the properties of the image:
– right click on the layer name
– choose properties
– go the styles tab
– arrange the order of bands to be like 3-2-1, choose “Custom min/max values” and set all min values to “-2000” and the max values to “16000” (this is specified i.e. in line 33 here), check “contrast enhancement” to be “stretch to MinMax”. The image will still look different as in Googlemaps… play around with min and max values. Min-values of “0” and max-values of 2000 seems fine for representation on screen.
The resulting image would look something like this: