
3D is soooo cool… Okay let’s be honest: the exciting times of Second Life are gone and the Oculus Rift is still not in sight in the end-user stores. But it is and was always cool to create you own 2.5D (we are using GIS not CAD, you know) visualization and make beautiful graphics for your papers or posters. It was always a big drawback for QGIS that ArcGIS was and is so good with ArcScene. But we’re proud users and we’ll use NVIZ. Let me show you how.
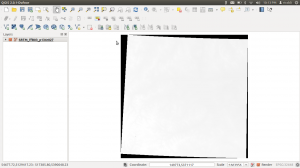
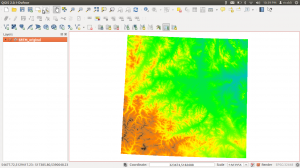
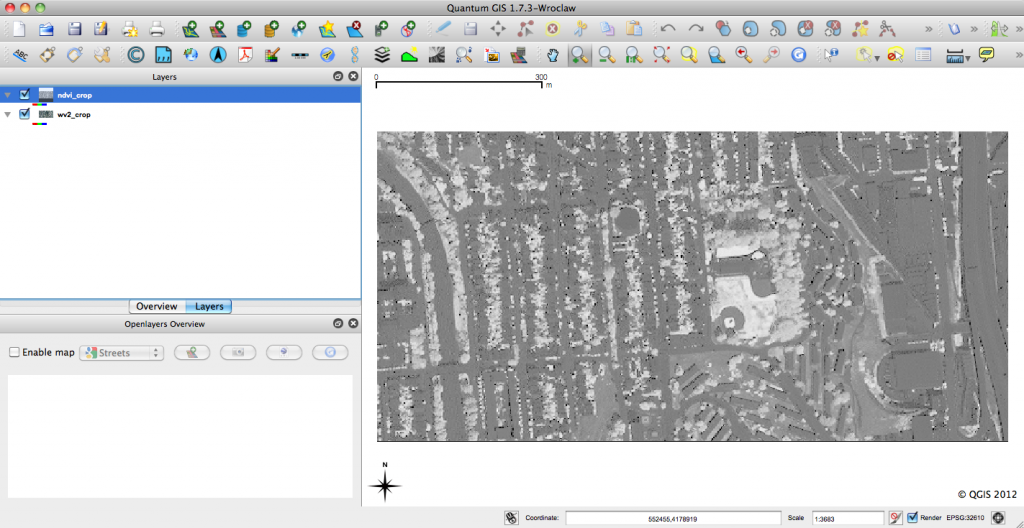
First thing you will need is a DEM. I love the SRTM data set as it is quite reliable and much better in my opinion than the comparable ASTER DEM (when it comes to flat terrain you may see cloud artefacts on the ASTER datasets) but I hope we’ll all benefit from the new world dem in a while . So we will start with a fresh download which gave us this dataset. Loaded into QGIS it looks really “boring” but we will deal with this:
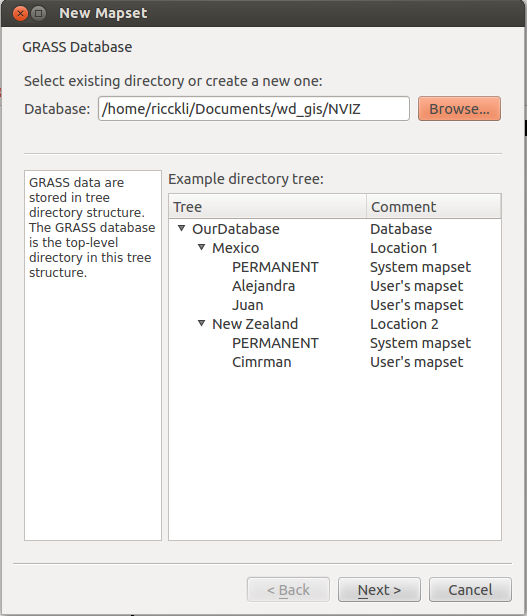
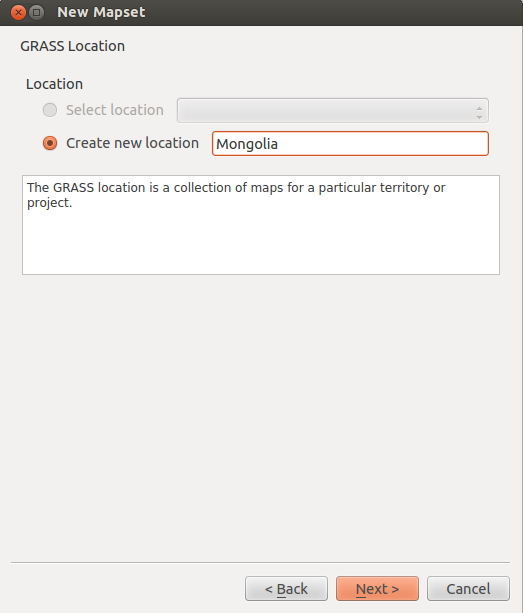
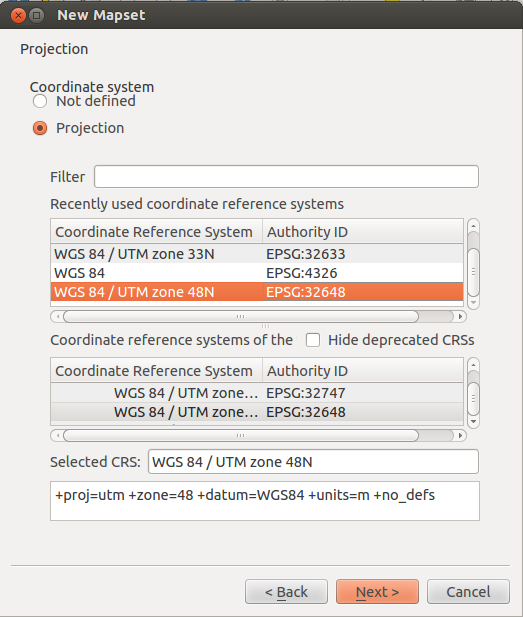
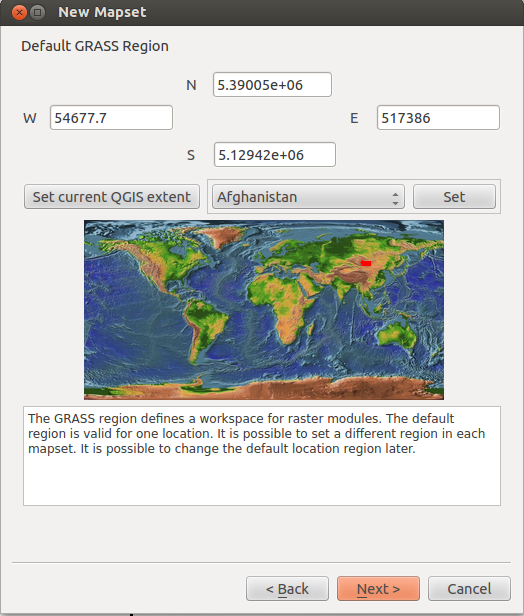
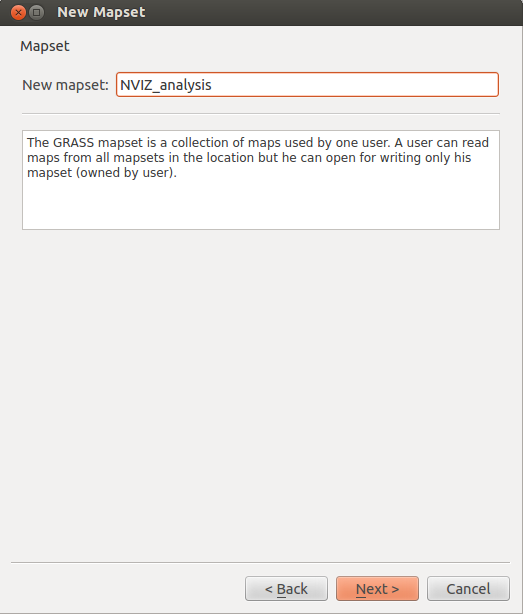
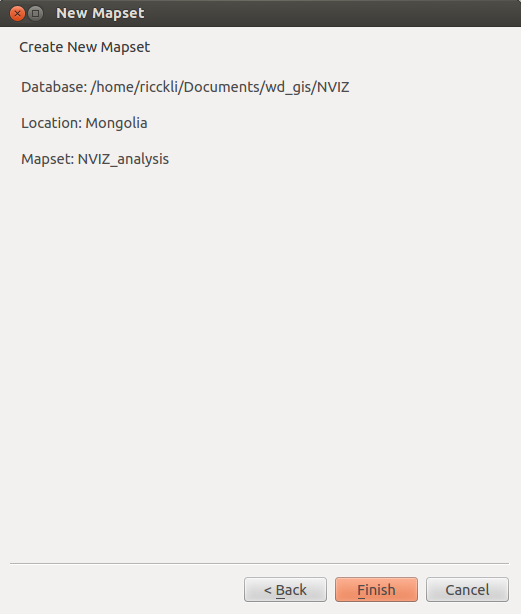
As we need NVIZ from GRASS we need to create a new region / mapset for our analysis. We start with this and give the raster more contrast after this: Make sure you have the GRASS plugin enabled and go to Plugins – GRASS – New Mapset :
First we need to import our raster data to the GRASS project. Therefore go to Plugins – GRASS – Open GRASS tools and open up the Modules List. Search for a function called r.in.gdal.qgis (the r stands for raster and not for R) and select your SRTM dataset as input and use a nice name for the output dataset which will look the same as the input once it is drawn in your GRASS project using the Plugins – GRASS – Import Raster dialogue or the show result button in the current function window
We will now clean up the imported raster data. First we need to get rid of the NULL values which are still coded as -32768. We will use a GRASS function called r.null.val! Therefore go to Plugins – GRASS – Open GRASS tools . In the Modules List you can filter by the name of the function and you will be shortly provided by the questions which raster to use and which value to be set to NULL. This will be -32768 in our case. This will result in a view on the data which looks worse than before. But now the r.colors.table function is our helping friend. Use the same raster as input and select the “Maps relative ranges of raster values to elevation color ramp” and your raster will shine like this:
As we have selected above our current region is a little wide for a 2.5D visualization. So we will create a smaller region to look at with the use of the dialogue Plugins – GRASS – Edit Current GRASS Region and draw the region on the map. Now we are ready to have a look in the 2.5D version using NVIZ in the GRASS tools: Just select the raster as the source for elevation and color and off you go by changing the size of this little fellow
[…] A la fin de ce mois d’avril, est sorti un plugin vraiment intéressant pour QGIS. Nul doute que ce dernier, permettant notamment la visualisation de terrains en 3 dimensions (ainsi que le drapage), deviendra un outil majeur de QGIS. Vizitown, c’est ainsi qu’il se nomme, permet d’être une alternative voir un outil de remplacement avec une prise en main et une installation beaucoup plus simple que Grass NViz. […]
Hi Riccardo,
very interesting post but I have a question for you.
What if you want to produce a 3D plot of a subsoil model of some variable (e.g. Soil Water Content). Data have the structure: X,Y,Z, SWC where X and Y are local coords, Z is the the height and SWC is the variable of interest.
Thank you for any suggestion.
Peppe
@giuseppe_calamita:disqus for this we used google sketchup in another project: https://www.youtube.com/watch?v=6_N-5j7PK7Q but for 4th dimension it is always hard. Maybe check this article for something like that:http://anitagraser.com/2014/03/15/3d-viz-with-qgis-three-js/
Hi Riccardo, great tutorial – thanks very much! Just a quick question, if I wanted to overlay a raster (i.e. a map) on top of the elevation data, how would I do it? Thanks in advance, Alex.
Hi Riccardo, thanks for the tutorial. What if NVIZ is now found in QGIS? I am using QGIS 6.4, and when I tried to create 3D, I got a message that “NVIZ not found”. So do you have solution for this?
many thanks
regards,
Naveen
Hi naveen. Just one question: there is no QGIS 6.4. if you’re running on windows install qgis2.4 with the simple installer and you will get GRASS with NVIZ right away
Hi Riccardo, sorry for that. It is 2.4 not 6.4. I did it but still have the same message.
thanks
Naveen
Hi there, I tried and in fact it seems that NVIZ disappeared from the last version of QGIS (2.4 and its GRASS plugin 6.4.3
Hi
Riccardo,
I need some help man.
I have a scanned topographic map of a river basin. I georeferenced it and now I
need to do all the other things. I have no idea how to proceed further. I need
to be able to do maps of slopes, landslide distribution, represent raveens,
etc, you know what I am talking about. Just point me to the write tutorials for
vectorizing and other stuff.
Thanks
Hey Riccardo,
thx for your tutorial. Its great..
I’m working with Qgis 2.14.6 In the Qgis Processing Toolbox I can find the NVIZ, but not in the GRASS Tools. I don’t get it..
When I’m trying to run the NVIZ in QGis, there is no erro mesage, but also no results!
Do you know the reson why?
Thank you