Yesterday QGIS 2.6 Brighton was released. Now all systems are supported as also KyngChaos compiled a new version for QGIS 2.6 (source). In this post, I thought myself to go through the advertised features and changes introduced, so it may be a bit far. So let’s follow the QGIS changelog.
Export DXF enhancements
DXF is not something I normally use, but in many CAD and measuring instruments (total stations type), it is a common format. Exports can be created via the menu (Project> DXF Export …).
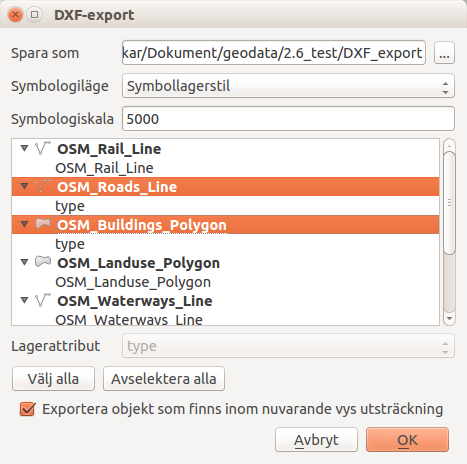
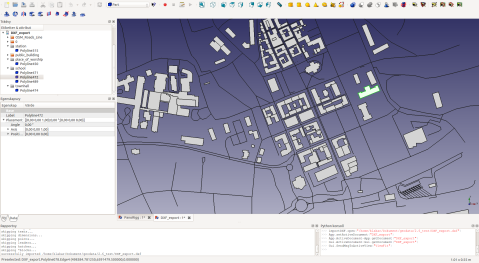
Since I am not used to work with DXF it is difficult to have views on this, but I tried to pick out some stock attributes and contents of these fields came under the “Layer” in the DXF file. The stocks chosen were very easy to export and when I tried to open it with freecad it looked like I would expect it (of course I am not an expert):
Filename in project properties
One small thing you might think:

But very useful if you do not know where your project is saved. You may use the links on the desktop to the project which is located on a server, for example for publications via QGIS server, and then you want to save the new data in the same place …
The measure tool
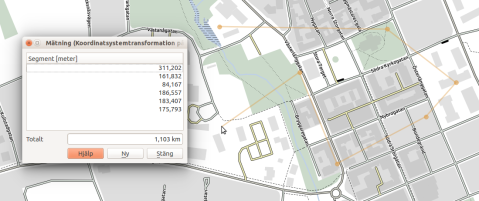
It has the appearance happened a lot and it is also possible to undo (reverse) the items you place out to measure things. Now it’s even easier to use the tool: You can use the “Backspace” as well as “Delete” keys, and it works very smoothly for both line and area measurement. The line that is created is now also a list of segments in which the length of each sub-segment displays. Hell yeah! Furthermore settings for colors and units can be changed (Settings> Options> Map Tools):
Edit interface
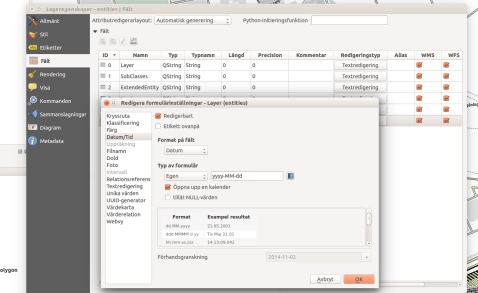
Many improvements of the types of fields that can be used in forms, and how these are applied. So you choose now within a great variety of formats for all data types
Use only selected data in the merge tool (Join)
Sometimes it’s just one or two columns in a table you are interested in adding to a geographic layer. If the table which contains a large number of columns, it is easy to pick and choose only those of interest now. This will decrease file sizes and makes it even easier to work with data.
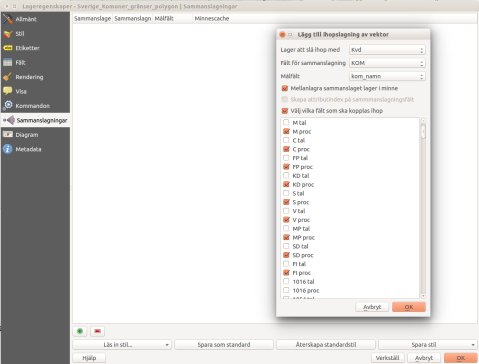
One table with election results above.I might just be interested in the percentage results for the major parties in different constituencies. The table contains many columns, however with both number and percentage of not only established national parties, but also all the local parties. So now it’s easy to pick those you really want!
Virtual field
You can make use of a “virtual” field in columns. These are not stored in the data store without the project file and the content is updated as soon as one uses the information depending on the data basing on the field.
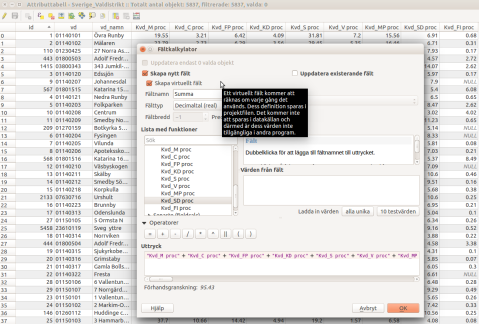
In other words, to create new attributes linked to the warehouse where one does not have write access, or storage you do not want to change. It could also be that you want to do a quick calculation for checking stuff (is there any constituency where the sum of the national parties percent is very low?), but for the sake of creating a lot of new data. A virtual layer disappears as soon QGIS ends, if you do not save the project, of course.
Personally, I think this aspect is one of the best with QGIS 2.6.
Icons for Commands
You can add an image as an icon for a command.
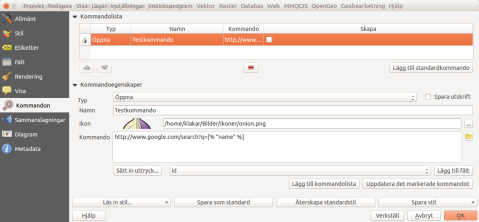
How useful this is might be debatable, especially when what I can see is only used in the dialog box shown in the image. Maybe it’s supposed to also be displayed when you select the tool in the map, but it does not. At least not in my QGIS build
Functions in the Expression dialog
There has been some functions in expressions dialogue already:
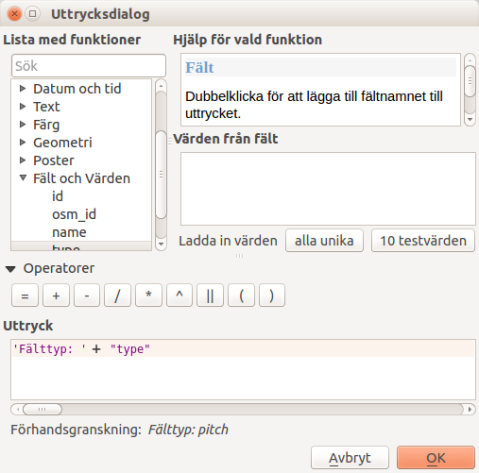
The most useful in my opinion is that you can now use the ‘+’ instead of ‘||’ when to merge text strings (pictured above) or concatenate function. The new features include ‘attribute ()’ and $ current feature.
Show / hide object classes separately
You can now turn on and off individual object classes in divided layers.
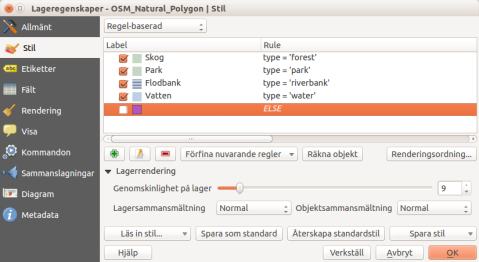
Above I use an ‘ELSE’ to catch the unrated items and not to show them on the map. It previously had to make a layer selection to achieve this. Now be as simple as a small ‘click’. Ignition and extinction of classes works with most types of zoning and can be performed even directly in the layer list …
Layer list
Here, there has been a lot of changes, in addition to the ability to show / hide individual layer items. QGIS has now some new buttons in the inventory list, of which the most useful for me is the filter to only include object classes that actually plotted on the map.
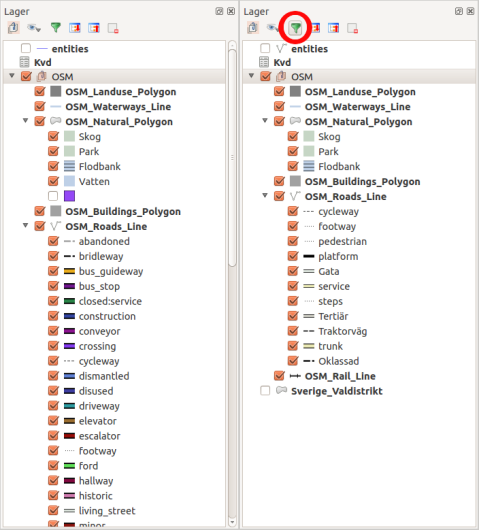
The same filters are available for printing as well, so now you don’t confuse the users of maps with symbols that are not used in the map itself.
Hide map elements from printing
Let’s say you place a help text in the printing layout. This should not be taken into exports or prints:
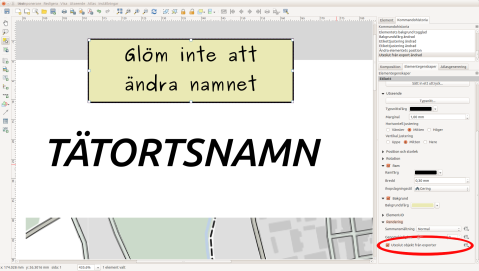
If one else has a finished the map layout but do not always want to have everything on the prints, the function can also be good to have. Would be nice to have: I would have liked to have seen a small mark on the items that are handled in this way, so it becomes clearly visible in the layout. Maybe a little image of a ghost, semi-transparent in one corner.
Empty frames
Now it is possible to mark pages with empty HTML or table borders whether they should be printed with a check box. It is perhaps useful for creating atlases (Atlas). If the map is a very small part of the job and the majority consists of general information obtained from a linked Web site, so it is perhaps unnecessary to print the pages where this link is missing …
A warning though! This can be a source of annoyance if you happen to have a blank HTML frame on the page with this feature enabled. It would probably be better with a warning to the user if a page is not exported, or printed out because of this.
Elements in print
Now there is a list of all the elements included in the print layout.
Here it is possible to hide / unhide or unlock various elements. Additionally you can change by double clicking the name of the element, and you can rearrange the list by dragging-and-dropping the lines in the order you want.
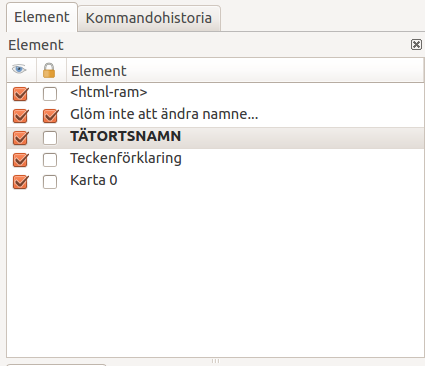
If you do not get any results from prints or exports, it might be good to check this. There might be an empty HTML frame that blocks everything else (see previous section).
Lines and arrows in print
Briefly, more control for them is offered now, thereby providing as much freedom in design you need:
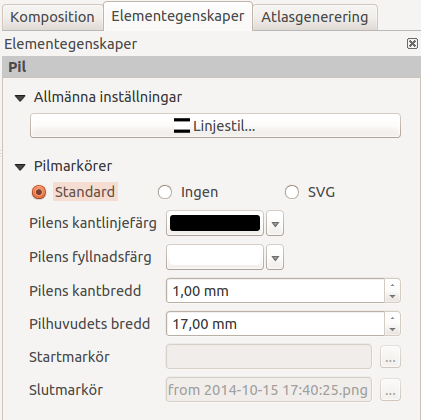
With SVG option there is no restriction on what can be done in the preview, as long as you can draw your own SVG arrows.
Data Defined override in print
Many properties of map elements can now be linked to the data characteristics itself. This includes, for example, rotation, position, and opacity. Now it is possible to have transparent objects in the print layout like in ESRI ArcGIS? I have to check, because that’s somehow useful any time when to change a map product.
Import Images from URL
The images you want to include in a printed map no longer need a local path. They can be specified now by http addresses.
Printing Tables
You now have much more control on how to print tables on a map.
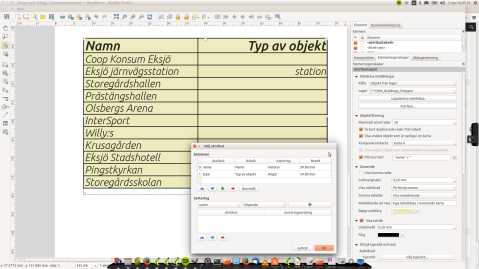
Now you can do a lot more with the tables. For example, you can have a table float out into multiple table frames, or decide in advance how wide columns should be so that these do not happen to cover up something that is important.
Printing Pt. 2
You can change orientation or rotation of arrows now more easily by holding down the shift key (defined steps). Shift and Alt keys can be used for other items as well: get them plotted expanding from a specified center, instead of a corner.

You can also change secondary colors of the scale bar. Feel free to play around. Items can also be moved by given pixel at a time by holding the Alt key while using the arrow keys.
Attach Tolerance in print
The tolerance is stated in pixel now.
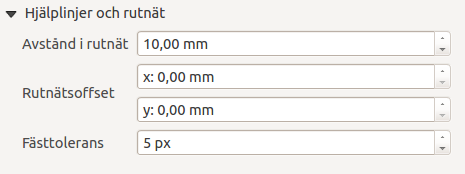
It becomes easier to manage snapping when you use the zoom function in layout.
Overview Maps
An overview map can have many marked detail maps now.
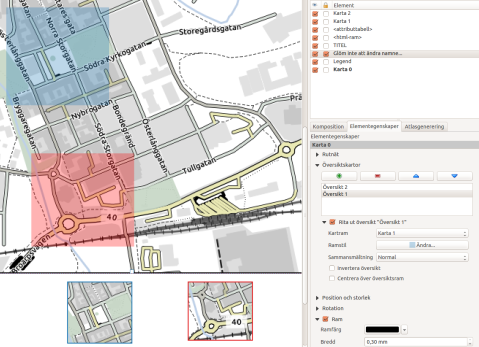
This is one of my favourite new features in QGIS 2.6 as well. In the picture above, I have changed the color of the marker and frames so that it will be easier to identify which map is available. If you do not like the semi-transparent color blocks, you can select polygons with only an outline too.
HTML frames
It is now possible to manually enter a HTML source code in the HTML frame.
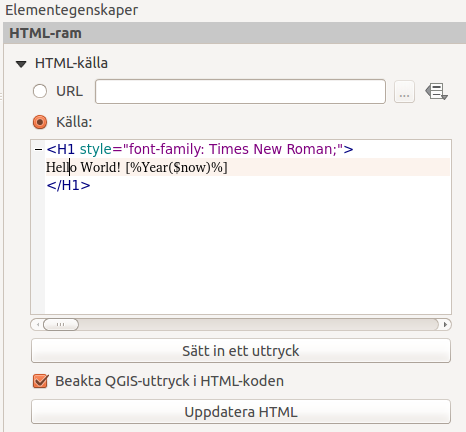
You can also build expressions to create dynamic HTML sources. If you want, you can use special QGIS expression directly in the code, for example by creating expressions. The image above is an expression to print the current year.
Several coordinate systems/nets on the map
My absolute favorite is the opportunity to have lots of grid based on different coordinate net on a single map. This is standard for the big Redland GIS software and has it’s place in QGIS now as well. Unfortunately I’m still waiting to simplify printed coordinates so that you can get get rid of some zeroes.

This is on the way, but it requires that a number of other problems are eliminated first, so be patient. Do not want to wait that long? Then you can contact QGIS project and go in as a sponsor for this function and thereby speed up the work.
Download tool online
Now you can connect to an online library of several scripts directly from QGIS.
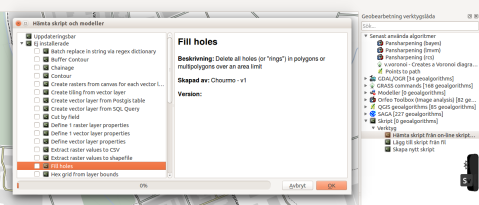
This library will be updated by the users themselves. The management seems to be much like it works for plugins.
New Model Builder
The Model Builder is completely reworked, but the new one is backwards compatible.
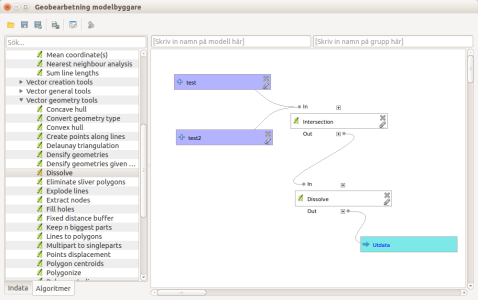
Modeller and scripts made QGIS very adaptable for special needs. There are some dependencies that must be taken into account sometimes, because some scripts require different add-ons are installed and enabled, but on the whole there is a lot of time to win if you repeatedly perform similar tasks using models instead of “click”.
Syntax Highlighter
It appeared in a picture before, where the html code occurred, that QGIS now helps you to keep track of code using colors and text styles. This makes scripting and programming in QGIS much easier.
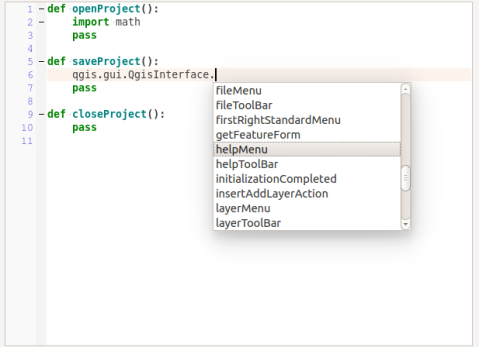
You will also get support on Python syntax and you will get help while writing code via a pop-up.
Managing Colors
This is also one of the nicer updates.
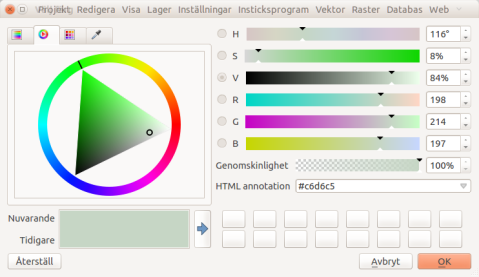
Now you can choose colors in a lot of different ways. Especially good: you can choose to capture a color from any part of the screen, not just from the QGIS application: Images or documents on a website can provide the colors you would like to use with an ease. So no more rgb code short term remembering ;-).
You can even create your own palettes where the colors are named in the project and the program itself. These palettes can of course be saved as a file and opened in another QGIS instance. There is also a new very nice color selector with a context menu which includes recently used colors listed.
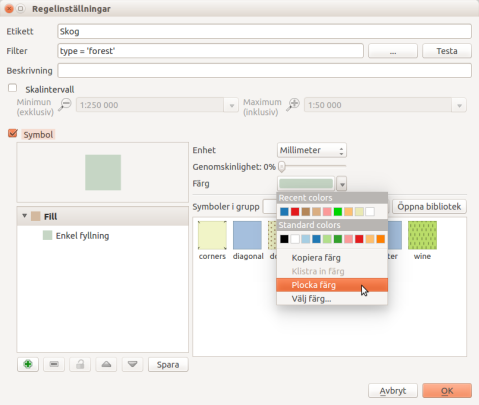
Projects or program palettes will be displayed here as well. A great tool!
Select Items
The former two buttons have become one button. When you need to select an item in the map you can do it with a click, or click-drag a square. The same tool for two functions. FTW!
Add to Map
Many processes create new layers in QGIS. By default, these will now be added to your inventory list.
Previously it was a choice that had to be done in nearly every plugin, is now standard. If you do not want to add the new layer to the map, you can uncheck the option in the current dialog.
Large Icons
For some reasons it might be needed: QGIS now supports unnecessarily large icons.
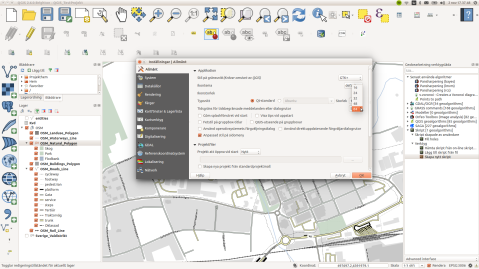
Especially useful if you use the touch-screen on a mobile device with QGIS for Android. As seen in the picture, it’s not all the icons that automatically gets bigger. It probably depends on the used plugin/functionality.
Identify
If you use the right mouse button with the identify tool you get a new menu 😉
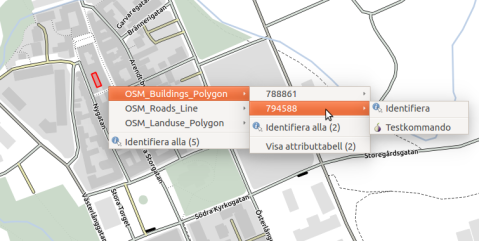
Instead of getting all the hits for the selected layer, you get a list of all identifiable layer hits. You can still ‘Identify all’, but you can already reduce the selection to something more manageable.
Oops! It appears my icon that I explained earlier. If there is a command linked to the layer you can choose whether to run it instead of ‘Identify’.
A few steps from the menu in the picture disappear when you right-click on a single item, but the principle is the same.
The ‘new’ identify tool is also on my favorite list of new features in QGIS 2.6.
Top Features
Phew!
It may not be so spectacular, however, the functionality of these features is extremely appreciated.
If you have someone nearby who helped make QGIS 2.6 to the impressive software it is, give it a big hug from me!
There are six favorites that ends up on my list of news.
- Several coordinate nets on printed maps
- Color management
- Use only selected data for joins
- Virtual fields in tables
- Identify tool: right-click menu
- Show / hide object classes separately
What are your favorites?
-see the original article on Klas’ blog geosupportsystem (swedish)



Congratulations for updating this so soon!
QGIS is a good stuff! Printer composer with several ccordinate grids and overview maps is great!!!
Thx!
Thanks for this!
I’m definitely most excited about the new color picker. That had been one of QGIS’s weakest features compared to other graphics programs like Inkscape.
thanks to you for the review and to the dedicated developers for all their hard work!