So we asked ourself: how can we increase the useability of clusters as we can’t change the location data itself? We came up with a quite nice approach: overview lists.
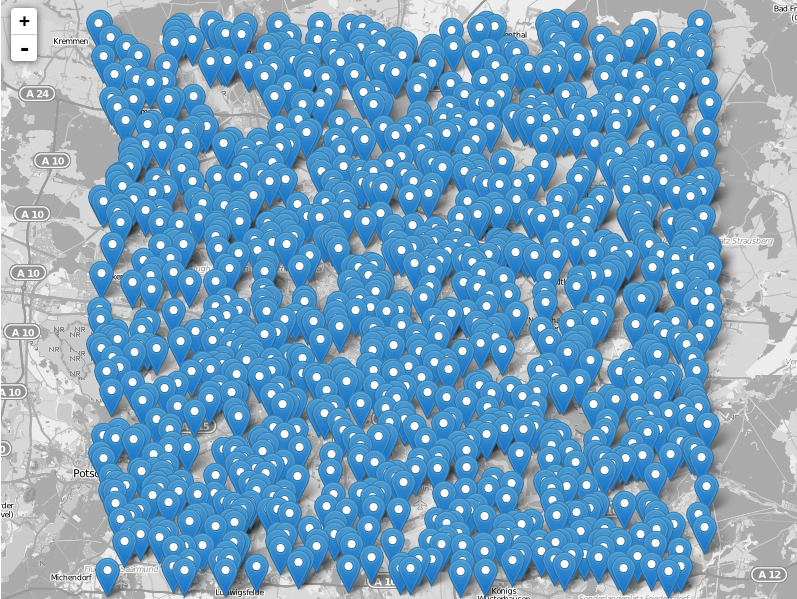
Too much Markers in your Clusters
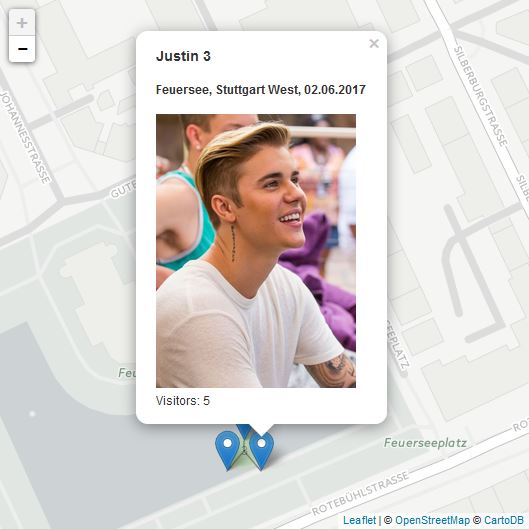
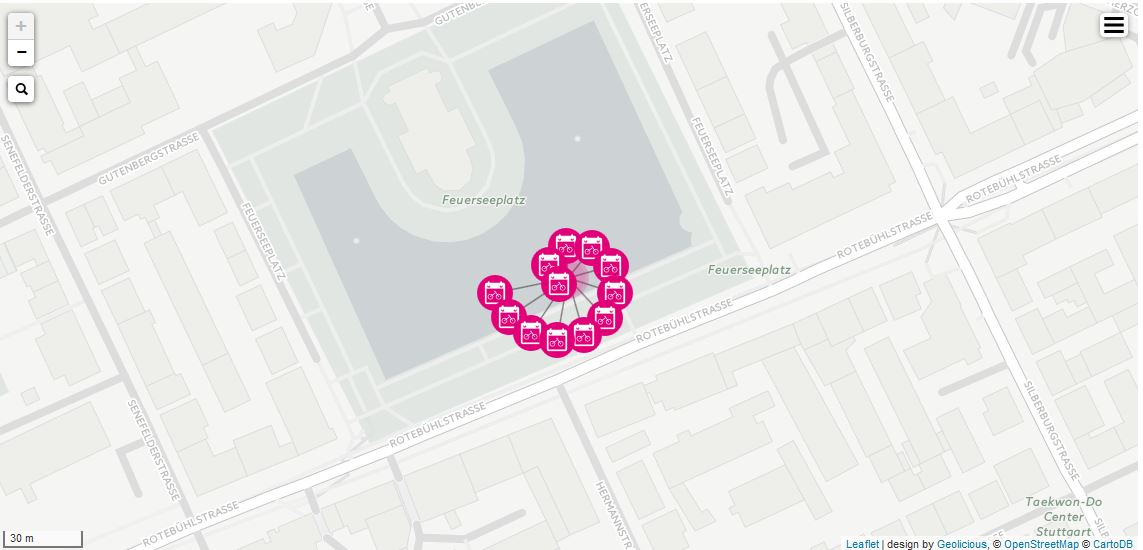
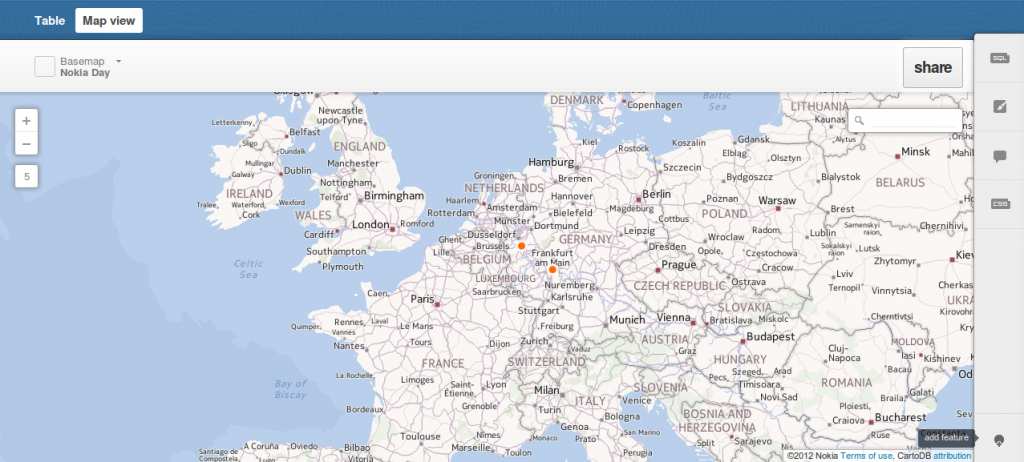
The starting point is the situation: too many features share exactly the same coordinate. By clicking on a cluster the cluster spiderfies and presents all markers inside the clusters. But at the very moment we are still unsure which is the marker of interest. So you need to open every marker and hope you’re lucky enough to find the JSTN you’re interested in:
<!DOCTYPE html>
<html lang="en">
<head>
<meta name="viewport" content="width=device-width, initial-scale=1.0, maximum-scale=1.0, user-scalable=no" />
<meta name="description" content="">
<meta name="keywords" content="">
<meta name="author" content="">
<meta charset="utf-8">
<script src="https://code.jquery.com/jquery-3.2.1.js" integrity="sha256-DZAnKJ/6XZ9si04Hgrsxu/8s717jcIzLy3oi35EouyE=" crossorigin="anonymous"></script>
<script src="data.js"> // data goes here</script>
<script src="https://cdnjs.cloudflare.com/ajax/libs/leaflet/1.0.3/leaflet.js"></script>
<script src="https://cdnjs.cloudflare.com/ajax/libs/leaflet.markercluster/1.0.4/leaflet.markercluster.js"></script>
<link rel="stylesheet" href="https://cdnjs.cloudflare.com/ajax/libs/leaflet/1.0.3/leaflet.css" />
<link rel="stylesheet" href="https://cdnjs.cloudflare.com/ajax/libs/leaflet.markercluster/1.0.4/MarkerCluster.Default.css" />
<link rel="stylesheet" href="style.css" />
</head>
<body>
<div id="map"></div>
<script>
var map = L.map('map', {zoomControl:true, maxZoom:18, minZoom:7}).fitBounds([[47.7931936169,7.5593073],[49.7572606169,10.4588028203]]);
var basemap = L.tileLayer('http://{s}.basemaps.cartocdn.com/light_all/{z}/{x}/{y}.png', {attribution: '© <a href="http://www.openstreetmap.org/copyright">OpenStreetMap</a> © <a href="http://cartodb.com/attributions">CartoDB</a>', subdomains: 'abcd'});
basemap.addTo(map);
function popUp(feature, layer) {
var text = '<h3>' + feature.properties['name'] + '</h3><h4>' + feature.properties['location'] + ', ' + feature.properties['date'] + '</h4><img src="' + feature.properties.image_link + '"width="200px" /><br>Visitors: ' + String(feature.properties.visitors);
layer.bindPopup(text);
}
var points = new L.geoJson(data,{
onEachFeature: popUp
});
var markers = L.markerClusterGroup();
markers.addLayer(points).addTo(map);
</script>
</body>
So we will work with this small basis.
The Solution
The solution is provided by the markercluster plugin itself as it offers a way to respond to “clusterclick” events. So we will listen to this event and if the event is called on max zoom level, we will open a popup with content that comes from the markers inside the cluster:
markers.on('clusterclick', function(a){
        if(a.layer._zoom == 18){
            popUpText = '<ul>';
            //there are many markers inside "a". to be exact: a.layer._childCount much ;-)
            //let's work with the data:
            for (feat in a.layer._markers){
                popUpText+= '<li>' + a.layer._markers[feat].feature.properties['name'] + ', ' + a.layer._markers[feat].feature.properties['date'] + '</li>';
            }
            popUpText += '</ul>';
            //as we have the content, we should add the popup to the map add the coordinate that is inherent in the cluster:
            var popup = L.popup().setLatLng([a.layer._cLatLng.lat, a.layer._cLatLng.lng]).setContent(popUpText).openOn(map);
        }
    })
This will now show us a nice list of some attributes inside the cluster: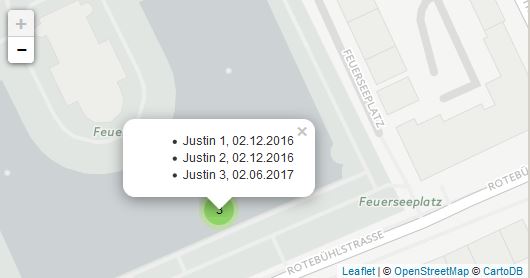
As we have the list now we will add some more magic so we can jump to the marker of interest and open the needed popup by simply clicking on the list entry:
function openPopUp(id, clusterId){
        map.closePopup(); //which will close all popups
        map.eachLayer(function(layer){     //iterate over map layer
            if (layer._leaflet_id == clusterId){         // if layer is markerCluster
                layer.spiderfy(); //spiederfies our cluster
            }
        });
        map.eachLayer(function(layer){     //iterate over map rather than clusters
            if (layer._leaflet_id == id){         // if layer is marker
                layer.openPopup();
            }
        });
    }
To call this function we need to extract the marker ID as well as the cluster ID from the cluster. We will do so by changing the line item:
popUpText+= '<li><u onclick=openPopUp(' + a.layer._markers[feat]._leaflet_id + ','+ a.layer._leaflet_id +')>' + a.layer._markers[feat].feature.properties['name'] + ', ' + a.layer._markers[feat].feature.properties['date'] + '</u></li>';
In the end it makes it easier to access the markers inside a cluster:You can download the whole map with the data.
I like this solution. I wish I could work out a good way to do something similar for overlapping polygons, rather than clustered points.
you need something like most likely for qgis2web? if so, I would propese to do this in the backend (python)…
I don’t think you can do it in Python – it’s responding to a client-side click in Javascript after the map has been generated. No client-side Python.
I know. I am proposing another way: create “ghost” polygons when you’re dealing with the polygons during export of the webmap. Ghost polygons are the result of intersecting polygons in one layer. this ghost polygon layer is added to the map but not to the layer overview and is only clickable if the parenting layer is visible. it contains the fetaures of all intersecting polygons.
Nice. That could work. Tricky if different polygons in the source layer have different styles. It’s an interesting way to achieve it, though. I thought one would have to implement point-in-polygon detection, which I imagine has poor performance.
Thanks for this example. I’m trying to do the same with overlapping polygons. It would be a nice improvement.
Hello, I’d like to know how do you make to show only the 3 markers info instead of All your markers info (4) ?? I have a map with culsters, and for exemple when I have a cluster with 2 markers, it shows me all my geoJson data (all markers) infos, instead of just the two that are in my clyster.. I tried with this code.. clusters.on(‘clusterclick’, function(a){
if(a.layer._zoom == 18){
var markers = a.layer.getAllChildMarkers();
for (var i = 0; i < markers.length; i++) {
$('#layer_infos .fill').append(html);
}
}
})
Amazing! do you know how to adjust either the in-between cluster lines CSS, or delay the transition after mouse click so that the black lines in the cluster disappear the same time as the icons. Big Thanks in advance!