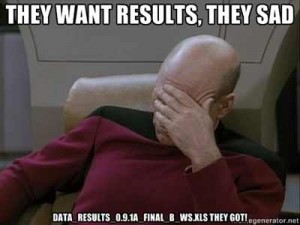
Due to my work with a multitude of statistical packages in my career I may be able to evaluate a lot of them. I’ve first used Excel for my calculations as most of the normal users do. I like the idea behind a spreadsheet and the combination of data and click-to-do functions. Nevertheless I’ve often managed to gain control again over my spreadsheets as they’ve evolved to some unintelligible things on my hard drive. The ruler of this evolution was spreadsheet “data_results_0.9.1a_final_b_ws.xls”…

The next package was MatLab. Don’t get me wrong: I love MatLab for it’s intuitive syntax and its great documentation. For teaching it is one of my favour scripting languages with statistical background. The GUI is fabulous as it gives you full control over your data and the m-file construction easily separates syntax/functions from data. Deploying little semi-automatic and automatic scripts is fairly easy. Additionally you can use the file exchange for enhancing your function pool and knowledge about using MatLab.
Then there was SPSS. It was the snake on the apple tree, the forgotten black sheep… I have used SPSS not in depth but I know that lots of dentists use it also for their statistical analysis. I mean: dentists, come on! So: nice interface, much more functions then Excel but it is really a click-and-do tool which seduces you to not understand what you are doing!
Then there is R. A forgotten angel in the desert stackexchange of usability. NOPE. R isn’t very user friendly. By saying “R was developed by statisticians for their own needs and teaching”, R encourages you to understand what you are doing. The R syntax is very rich and easy to understand. Yet the GUI sucks. But by using RStudio you will get the beloved GUI from MatLab/SPSS and the enormous power of R. Additionally you will get thousands of packages for free to enrich your methods and possibilities. Yet the documentation of some of them is not as good as it should be. But coming to an end it is for free and !!! If you would like to use it and need some advisory you can also get instant support by many resources on the web like stackexchange or even companies…


[…] reading and trying out. digital-geography.com has featured a little list of tutorials for MatLab. Due to my feelings about MatLab I would confront you with my own R introduction for statistical programming inspired by this one: […]