CSVs and leaflet: the ultimate ressource
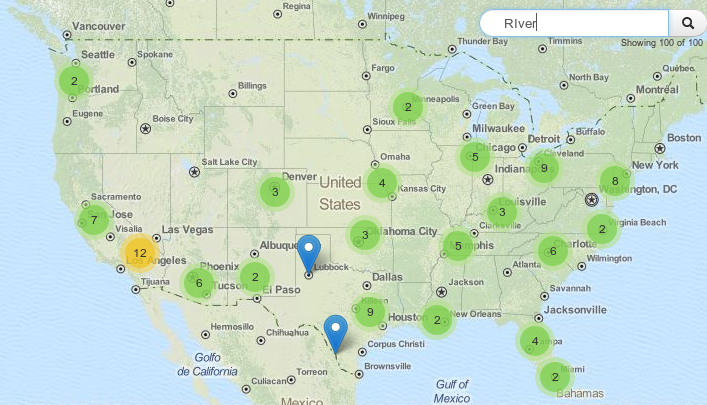
When it comes to certain tasks the usage of leaflet can be tricky. Of course it claims not to be the ultimate webmapping solution but one of the…
When it comes to certain tasks the usage of leaflet can be tricky. Of course it claims not to be the ultimate webmapping solution but one of the…
We love leaflet. In fact we have done some great projects with this nice little piece of code like our job-map. As I’ve checked the news from leaflet:…
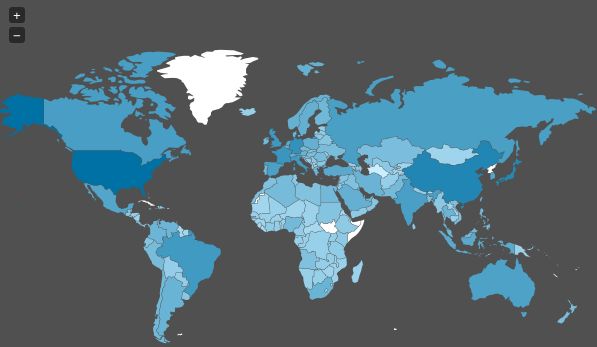
Today I stumbled upon a “map” on Spiegel Online ( an import news page in Germany ) which shows the spied countries of the NSA. As we already…
I just found a nice web interface for converting Shapefiles to geoJSON, the preferred format of vector geodata on the web. And yes, you can also convert back…
The time when I studied Geography and Mathematics is long ago. So I chose Cartography as one major part of my studies and learned to draw circles and…
The web is built upon a small set of languages that are present everywhere. Besides HTML, Javascript is the most common technology around here. So it is not…
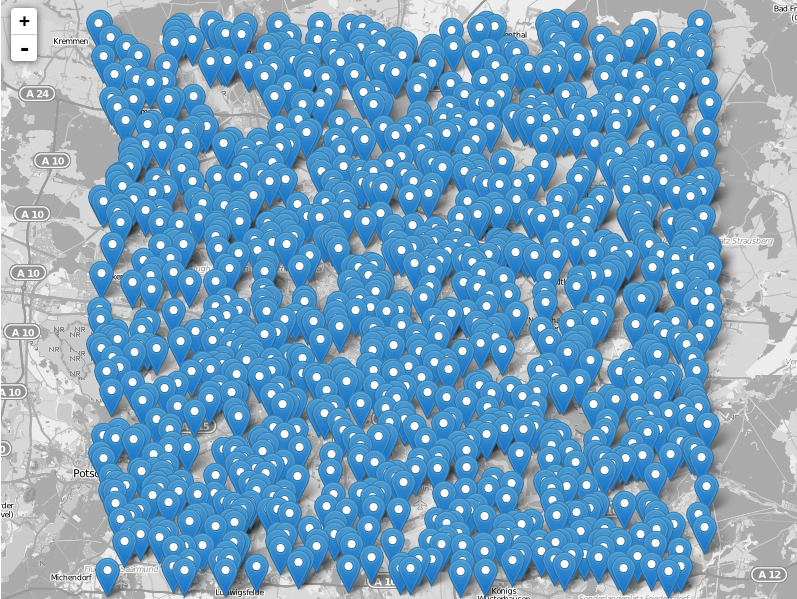
The leaflet API is very simple and tries to deliver best performance and style for commonly used features like tilelayers, points and lines and markers in general. So…
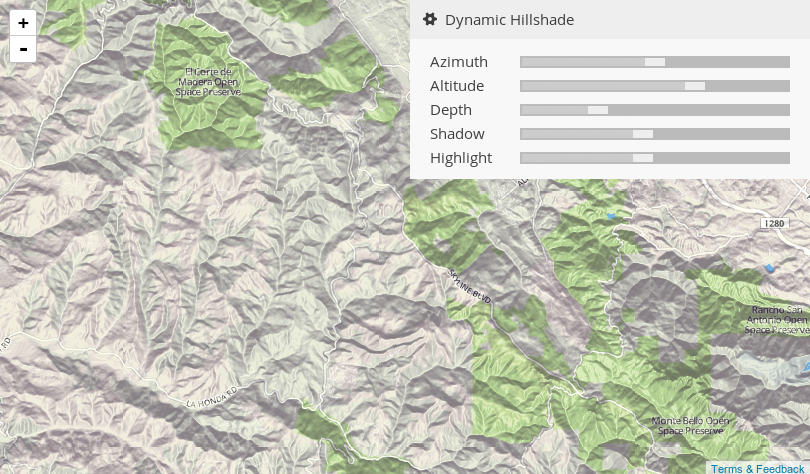
Thanks to the Twitterline of @directionsmag I’ve seen this new beautiful tiled WMS: OSM roads (new)
When Mike Bostock published his (re-) implementation and demonstration of Visvalingams algorithm for line simplification he attracted considerable attention on that. What is a little bit strange in…
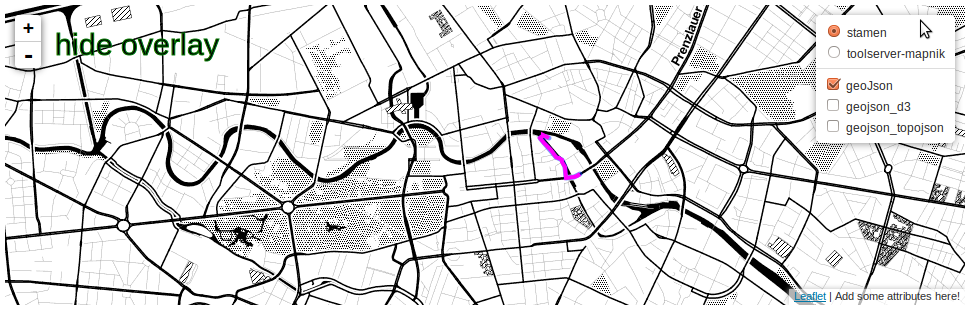
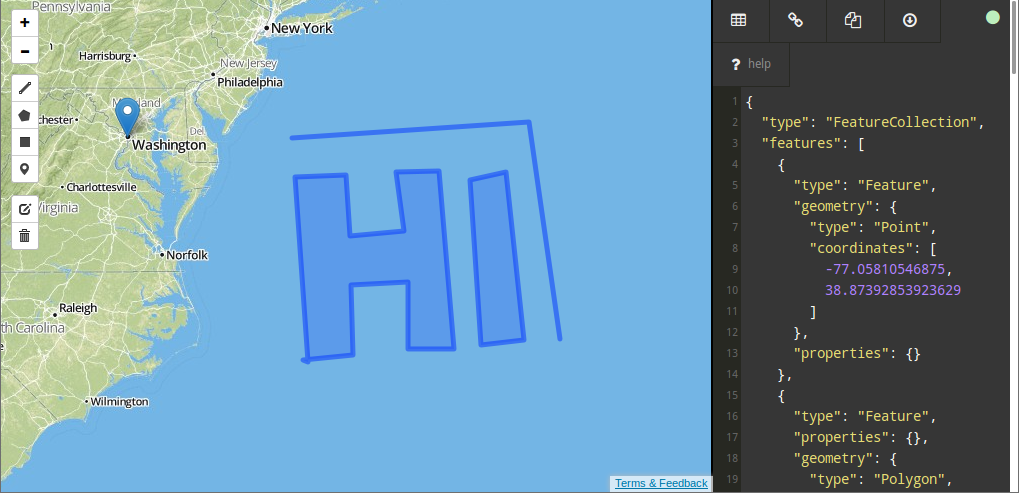
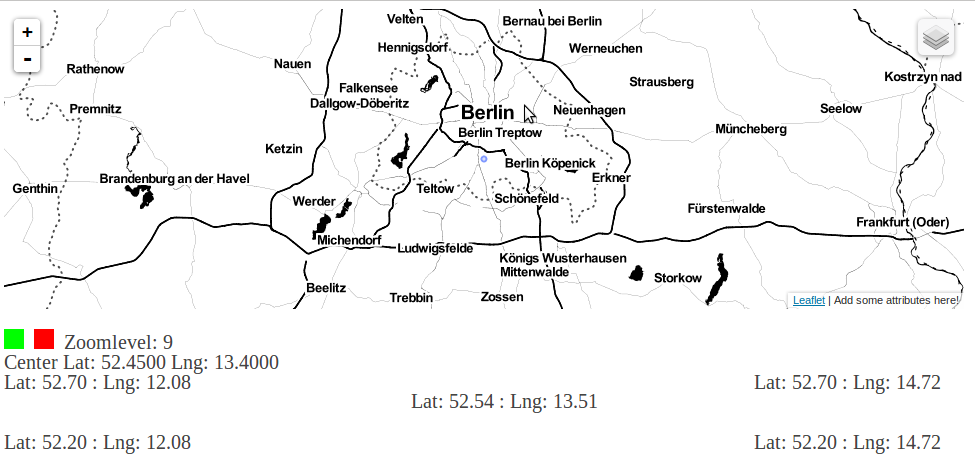
Within that tutorial I will show you how to: add a geoJSON file using pure Leaflet open a geoJSON file with D3 open a TopoJSON file with D3…
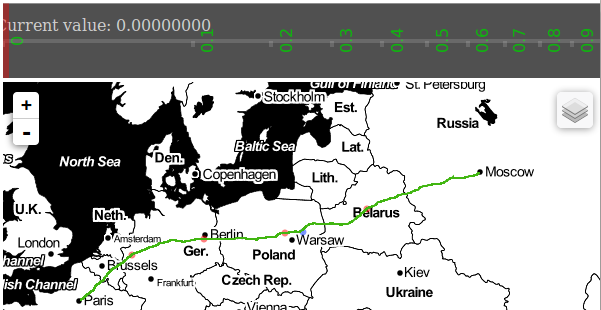
Within this, 2nd basic D3 tutorial, I will show you how to combine D3 with Leaflet whereby each library can demonstrate its vantages! These will be the main…
Since a while I am programming with the JavaScript library D3.js … and … I am addicted to it! As I would like to present some tutorials on…