Short Announcement: Leaflet 1.0
Leaflet is one of a kind in the list of javascript webmapping libraries. It was designed with simplicity, performance and usability in mind. Unfortunately the development seemed to…
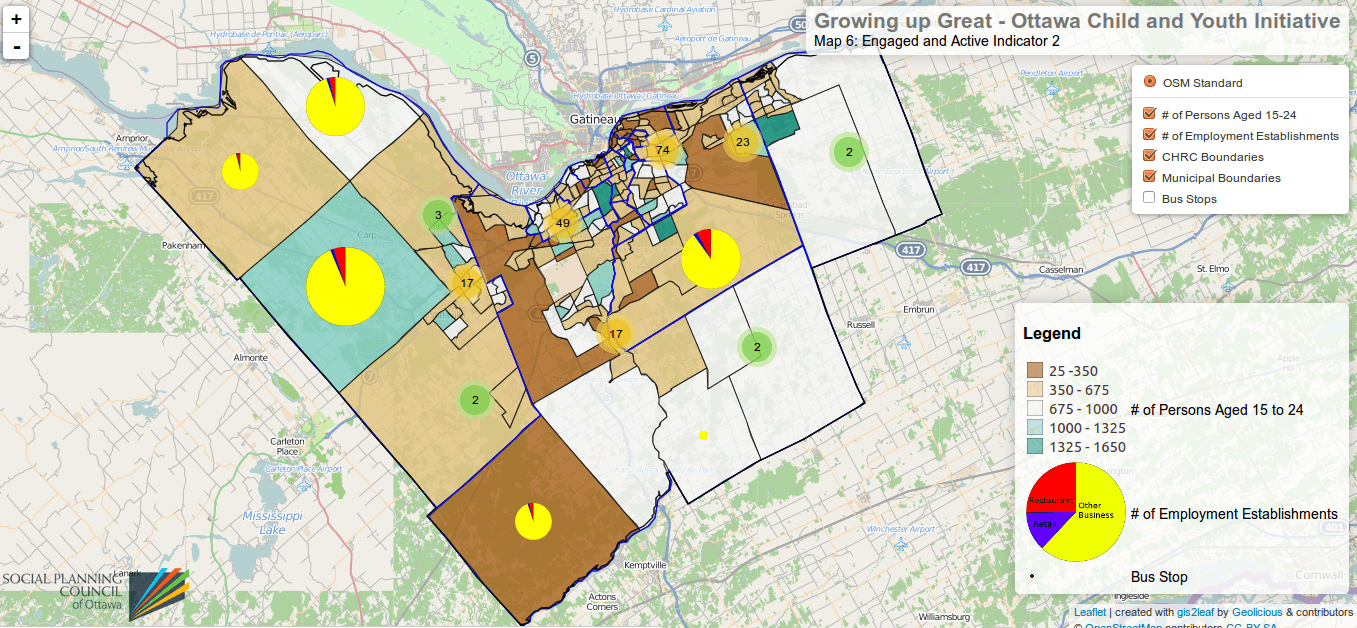
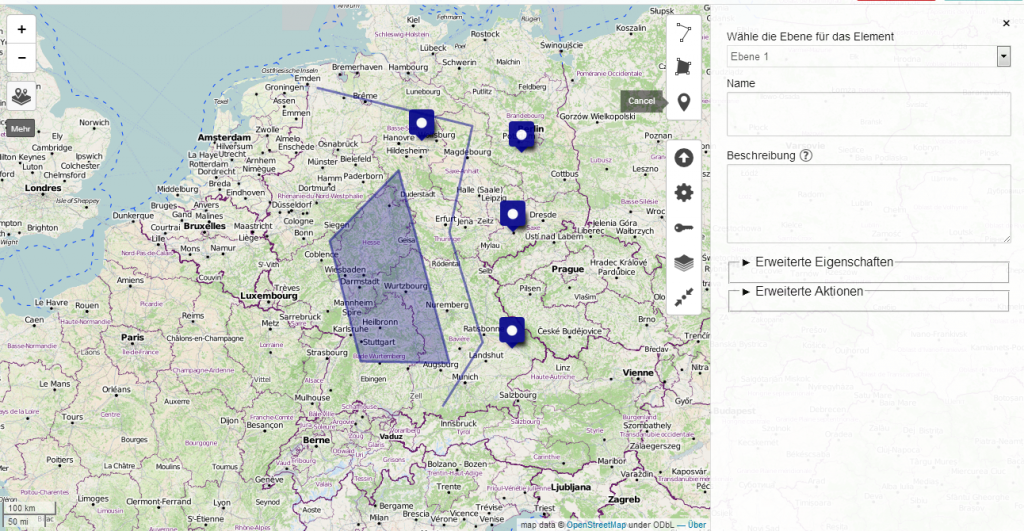
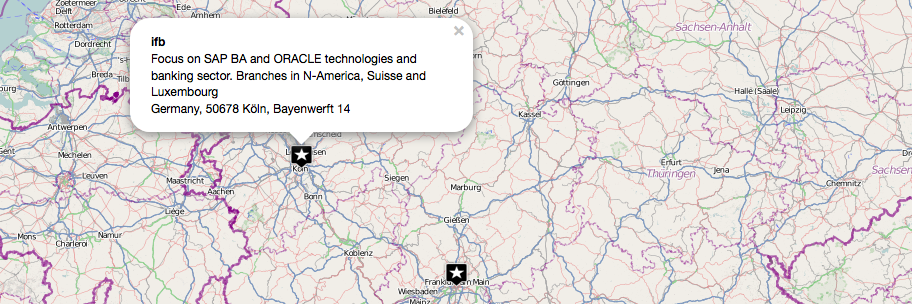
This tutorial will explain you how to create your own, interactive webmap in a fast and easy way! Such webmaps are used zo visualize e.g. adresses on digital maps. I’m using QGis 2.4 + Qgis Plugin Qgis2Leaf, google spreadsheet and a macro, wich I’ll tell you later about.
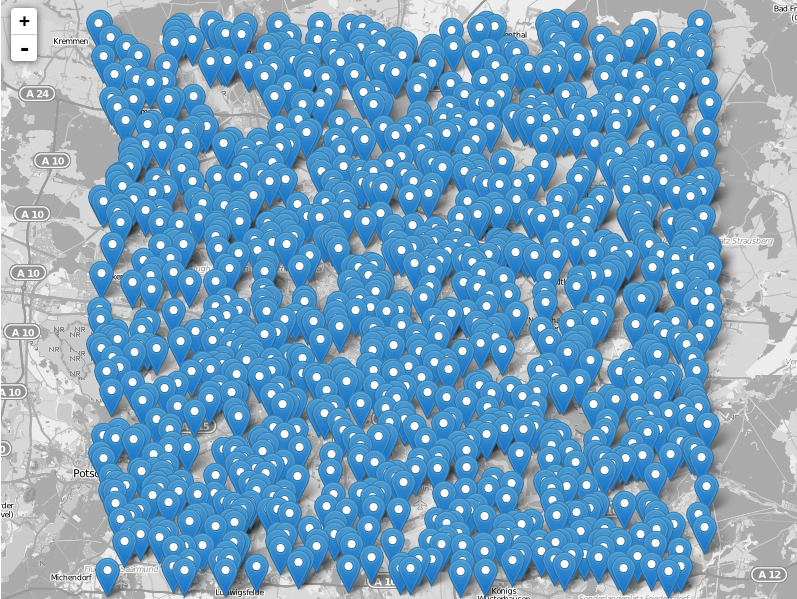
When it comes to certain tasks the usage of leaflet can be tricky. Of course it claims not to be the ultimate webmapping solution but one of the…
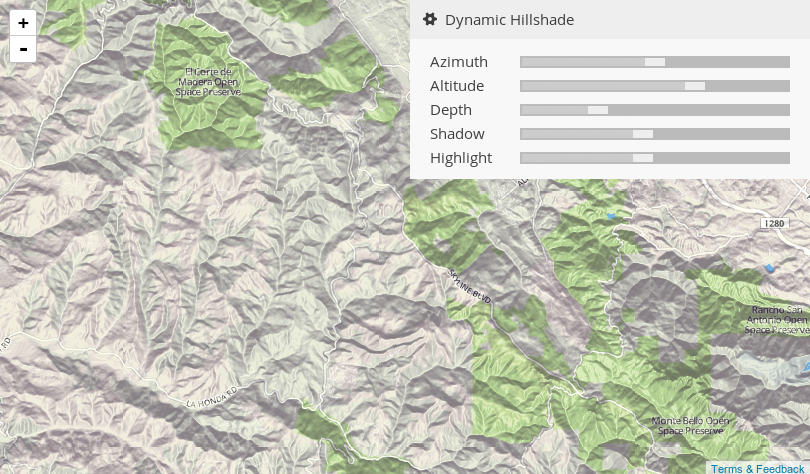
Creating maps is the most appropriate way to present spatial data. In the last years several methods appeared to generate such webmaps. Based on a tile-layer, wich contains…
We love leaflet. In fact we have done some great projects with this nice little piece of code like our job-map. As I’ve checked the news from leaflet:…
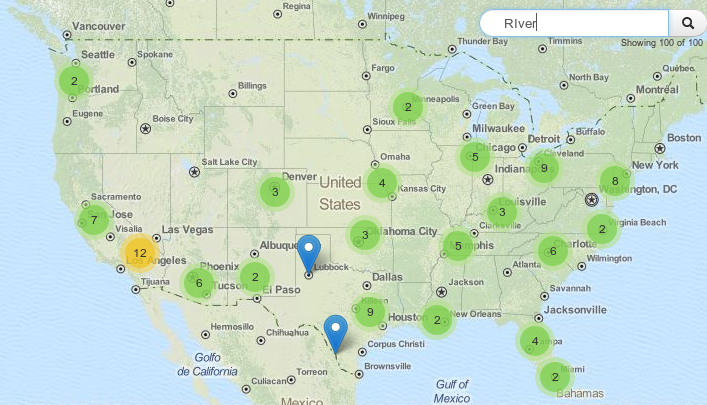
The leaflet API is very simple and tries to deliver best performance and style for commonly used features like tilelayers, points and lines and markers in general. So…
In our first post we concentrated on the creation of a table in leaflet and simple ways to administer our data and to embed the map in a…
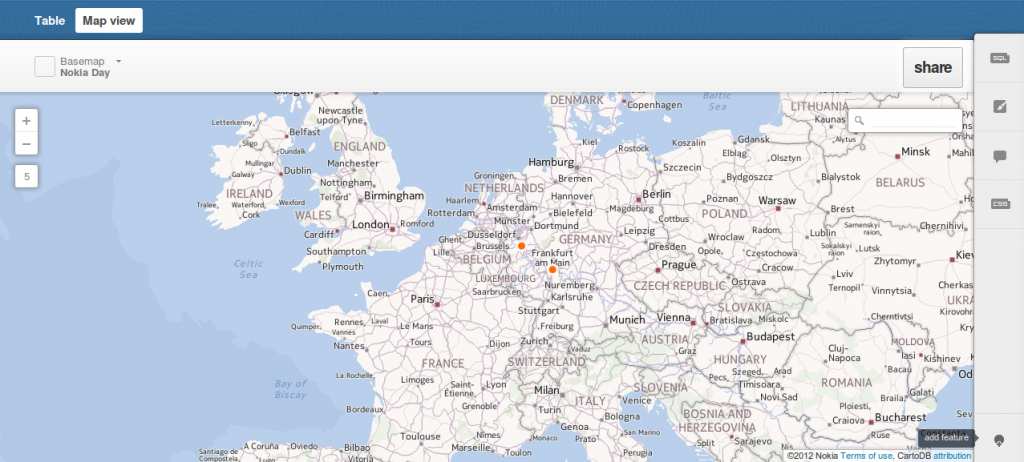
We have already introduced cartoDB which is a platform for storing, administering and visualizing spatial data. One straight feature of cartoDB is the usage of GeoJSON for exporting…
Some days ago NASA has released “Black Marble”, an image of the world by night, a combination of photos taken by a new satellite. Its name was chosen…