In our first post we concentrated on the creation of a table in leaflet and simple ways to administer our data and to embed the map in a webpage. Today we will consume only the table with Leaflet.
Let’s dive into leaflet
Let me cite the text from leafletjs.com: “Leaflet is a modern open-source JavaScript library for mobile-friendly interactive maps.
It is developed by Vladimir Agafonkin with a team of dedicated contributors.” So it is very comparable with openlayers but looks much fresher. There are several possibilities to implement WMS, WFS, tilemill or vector data. Be mentioning vector data we are close to our task: visualize each point of our cartoDB table as cartoDB provides an API to get the table as GeoJSON.
the html document
So as in our examples of a webmap based on openlayers, we need to declare a html document:
<!DOCTYPE html>
<html>
<head>
<title>Consultancy companies in Germany</title>
<meta charset="utf-8" />
<link rel="stylesheet" href="http://cdn.leafletjs.com/leaflet-0.4.5/leaflet.css" />
<!--[if lte IE 8]>
<link rel="stylesheet" href="http://cdn.leafletjs.com/leaflet-0.5/leaflet.ie.css" />
<![endif]-->
<link rel="stylesheet" href="http://scripts.digital-geography.com/dg_leaflet_map/map.css" />
</head>
<body>
<div id="map"></div>
<script src="http://cdn.leafletjs.com/leaflet-0.4.5/leaflet.js"></script>
<script src="http://scripts.digital-geography.com/dg_leaflet_map/leaflet-providers-0.0.2.js"></script>
<script src="http://scripts.digital-geography.com/dg_leaflet_map/L.CartoDB.js"></script>
<script src="http://scripts.digital-geography.com/dg_leaflet_map/map_DG.js"></script>
</body>
</html>
So let us have a closer look on the code:
- lines 4 to 10 define somehow the style of the map: how does animations are handled, how are the popups defined and so one.
- lines 14 and 15 are the basic javascript sources of the functionality of vector data and basemaps (leaflet-providers).
- line 16 enhances the leaflet functionality to consume cartoDB data and is provided by our twitter follower Bjørn Sandvik.
- line 17 is our own “webmap”-functionality
the basemap
As the main content is served by the map_json.js file we will concentrate on it. The first lines initialize the map and define a base map our vector layers will be drawn on:
// Init
var map = L.map('map').setView([51.0, 10.0], 6);
// Base Layers and Layer Control
var base = {
"S/W" : L.TileLayer.provider('OpenStreetMap.BlackAndWhite'),
"TOP":  L.TileLayer.provider('Thunderforest.OpenCycleMap'),
"OpenStreetMap": L.TileLayer.provider('OpenStreetMap.Mapnik')
};
- line 2 defines the initial map to be centered on 51°N and 10°W with an initial zoom level of ‘6’.
- line 4 defines our initial base map setup. we will use three different types of basemaps. For using ‘L.TileLayer.provider’ you will need the link to ‘leaflet-providers-0.0.2.js’ as marked above.
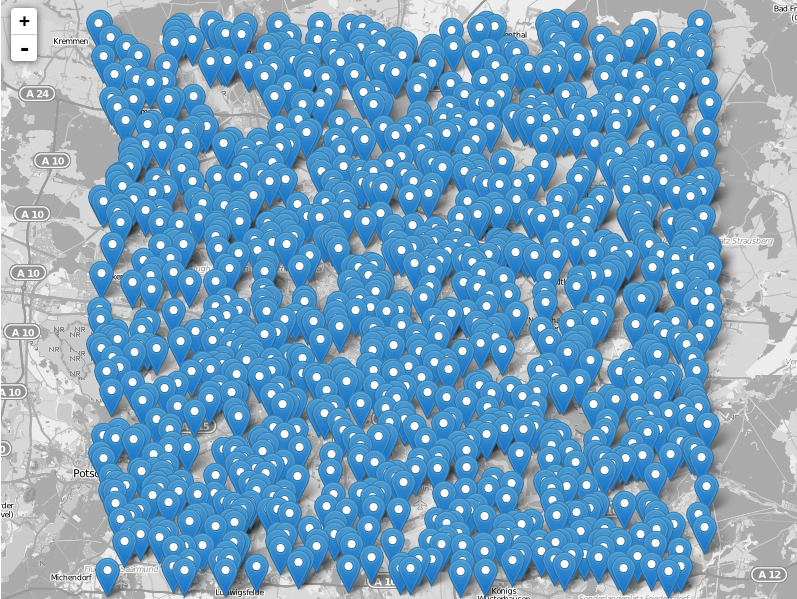
the vector data
So let’s explore our cartoDB table:
overlays = {
"Offices": L.cartoDB('http://ricckli.cartodb.com/api/v2/sql?q=SELECT * FROM consultancy_offices_in_germany', {
pointToLayer: function(feature, latlng) {
return L.marker(latlng, {
icon: L.icon({
iconSize: [27, 27],
iconAnchor: [13, 27],
popupAnchor: [1, -24],
//iconUrl: feature.properties.image//
})
})
},
onEachFeature: function(feature, layer) {
layer.bindPopup('<strong>' + feature.properties.name  + '</strong><br>' + feature.properties.description + '</br>' + feature.properties.adress);
}
})};
As you can see this is more or less divided in three parts:
- 1) the name of the layer ‘offices’ as it is part of the vector group ‘overlays’. This makes it easy to group your layer elements if you want to serve several elements as it is possible to add SQL-statements in the URL. You can see this by the statement ‘q=SELECT * FROM consultancy_offices_in_germany’ already and you can add something like ‘WHERE class = 2’ if you have an attribute ‘class’ in your cartoDB table.
- 2) the definition of the layer as it is represented by an icon with a defined size (27px*27px) an anchor point of the icon regarding the position of the feature itself. The icon has a fixed size and the point itself has actually no width at all… The popupAnchor position refers to the position the popup will com up regarding the vector (latlng served by geoJSON object). Additionally we have commented this out but you can store a link to a icon as png or svg (visit noun project for great vector symbols!!!)
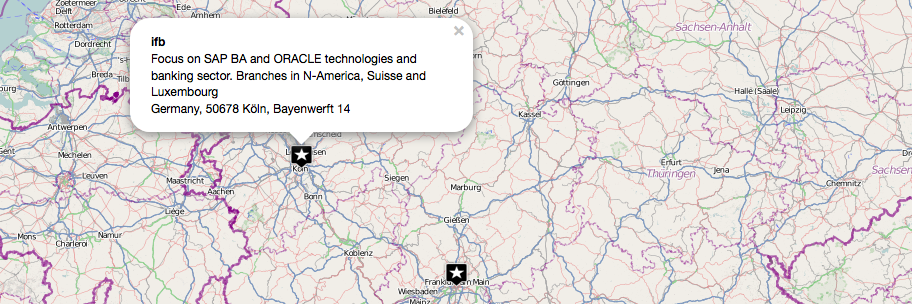
- 3) the description of the layer popup. It is setup by the attributes of each object in the table. Look at the HTML-description as it allows us to style our popups. So we use ‘name’, ‘description’ and ‘address’.
Well that is the underlying definition of the elements. Lets go the map itself.
the important remaining
Now we need to pack everything together into the map object.
- Add the baselayer:
map.addLayer(base.OpenStreetMap);
the connotation ‘base.OpenStreetMap’ refers to the object ‘base’ where we have three basempas defined and we will the ‘OpenStreetMap’.
- Add the vector data:
map.addLayer(overlays.Offices);
- Add some change-control to the map:
var layersControl = L.control.layers(base,overlays);
layersControl.addTo(map);
That’s it actually. You can download the files here. Now lets have a look on the map:
If you have any questions yous hould visit stackexchange or the guys directly at leafletjs.com…